The Transpacific Tipping Point: Navigating Capacity, Tariffs, and Route Strategy

Sarah Martinez
Logistics Correspondent
April 30, 2026
DATELINE: NA TRADE WIRE
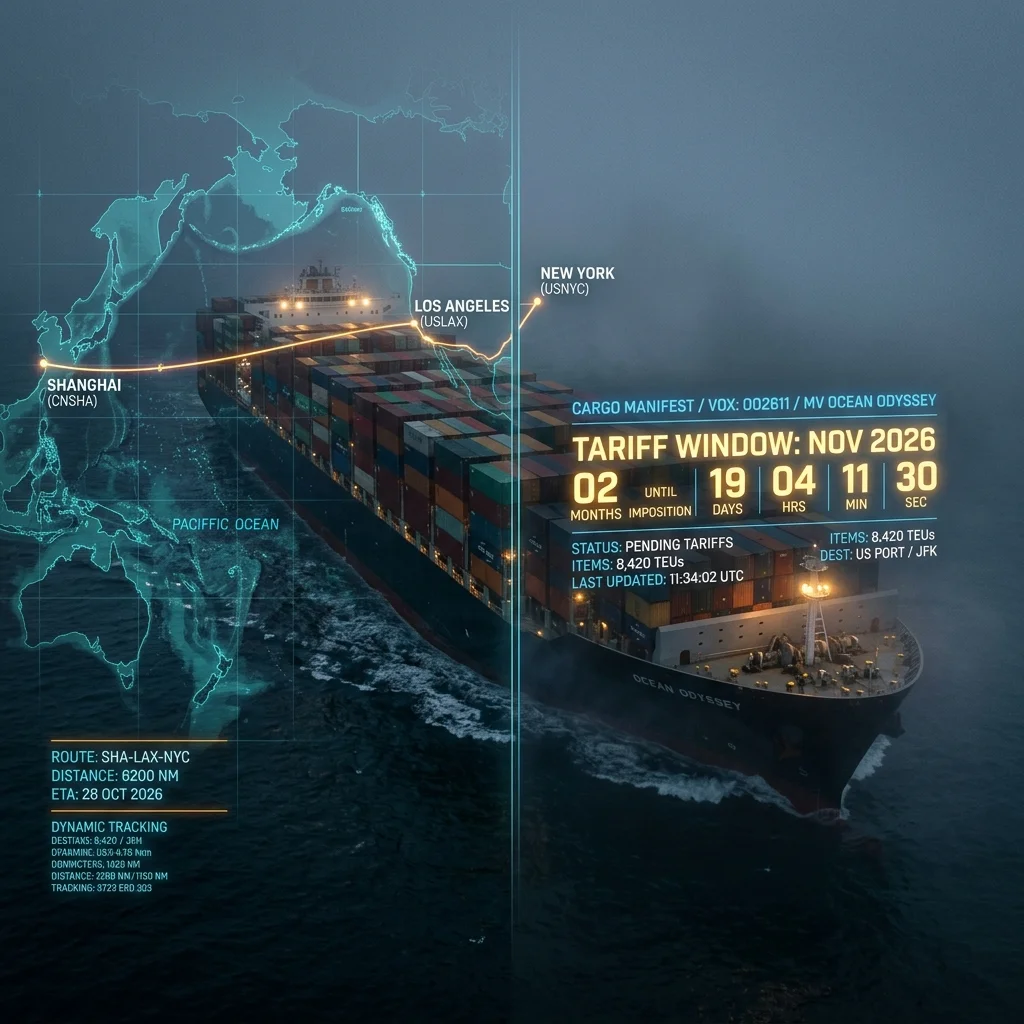
"The Asia-to-North America trade lane is undergoing a structural recalibration."
The Transpacific Tipping Point: Navigating Capacity, Tariffs, and Route Strategy in 2026
The 22 Million TEU Paradox: Volume vs. Velocity
The Asia-to-North America trade lane facilitates the movement of approximately 22 million TEUs annually (Source 1: Industry Volume Data). This absolute volume masks a structural disconnect: demand growth is projected at only 2.4% for 2025, while fleet capacity expanded 9.7% in 2024 and is projected to continue at 8.7% annual growth through 2028 (Source 2: Fleet Expansion Data). The container ship orderbook has reached a record 8.3 million TEUs—representing 27% of the existing global fleet (Source 3: Orderbook Statistics).
This is not a demand-side problem. The market is experiencing a velocity crisis. Carriers are injecting capacity at a rate 4x faster than demand growth, fundamentally altering the power dynamics of rate negotiations. The historical shipper priority of securing space allocation has been replaced by a more pressing concern: rate leverage. When supply grows at 9.7% against demand at 2.4%, the imbalance creates downward pressure on freight rates that carriers cannot indefinitely absorb.
The consequence is a market where carriers will compete on price rather than service reliability. Shippers who understand this dynamic can negotiate contracts that reflect the structural oversupply, rather than accept legacy pricing models built on scarcity assumptions.
Route Strategy: The Calculus of Time, Cost, and Risk (West Coast vs. Panama vs. Suez)
Three primary route corridors connect Asian manufacturing centers to North American markets, each with distinct trade-offs in transit time, cost exposure, and operational risk.
Asia to US West Coast (Direct): Transit time of 12–14 days from major North Asian ports (Busan, Yokohama, Shanghai, Ningbo) to Pacific Southwest destinations (Los Angeles, Long Beach) or Pacific Northwest gateways (Seattle, Tacoma). This route offers the fastest ocean transit but requires intermodal connectivity via IPI (Interior Point Intermodal) for inland destinations—moving cargo from West Coast ports to interior US markets via rail or truck. The cost-differential between IPI and all-water East Coast routing is a hidden leverage point: rising rail costs can erode the time advantage of West Coast routing.
Asia to US East Coast via Panama Canal: Transit time of 17–22 days from Asian origins to East Coast ports (New York, Norfolk, Savannah, Charleston, Jacksonville). The Panama Canal introduces variable risk: drought conditions in 2023–2024 reduced daily transit slots and increased fees, creating a bottleneck that forced carriers to re-evaluate routing strategies. Shippers using this route must account for potential transit restrictions that can add 3–5 days of unpredictability.
Asia to US East Coast via Suez Canal: Transit time of 24+ days, longer but bypasses Panama’s infrastructure constraints. This route serves as a strategic alternative when Panama Canal transit becomes cost-prohibitive or unreliable. However, the distance increases fuel costs and carbon exposure, making it viable primarily for cargo with lower time sensitivity.
Operational Compliance Layer: FMC (Federal Maritime Commission) filings must be completed before container gate-in; failure results in carriers applying tariff rates rather than negotiated contract rates (Source 4: Regulatory Requirement Data). AMS (Automated Manifest System) filing is mandatory before vessel departure for all US-bound shipments. These compliance requirements create a high-stakes window: a single filing error can override an otherwise optimized route strategy, converting negotiated rates to spot tariff pricing.
The Tariff Arbitrage Window: Exploiting the 29.3% Rate Until November 2026
US-China tariffs have moderated from their peak of 145% to an effective rate of approximately 29.3%—but this reduced rate window extends only until November 2026 (Source 5: Tariff Data). The clock is ticking on one of the most significant trade opportunities in recent years.
Strategic Implications: Shippers sourcing from China must front-load inventory or negotiate long-term contracts that lock in the 29.3% tariff rate before the November 2026 expiration. After this date, rates could revert to higher levels, fundamentally altering the cost structure of Asian-sourced goods entering the US market.
Contract Timing: TPEB (Transpacific Eastbound) contracts run from 1 May to 30 April of the following year (Source 6: Contract Cycle Data). The current window—extending through April 2026—represents the last full contract cycle before the tariff reduction expires. Shippers entering negotiations for the May 2026–April 2027 cycle must consider whether tariff rates will remain at 29.3% or escalate mid-contract.
Rate Determination Mechanics: Rates are applied based on the container gate-in date. For multiple containers under the same bill of lading, the rate is determined by the last container’s gate-in date (Source 7: Rate Calculation Rule). This creates a logistical imperative: shippers must coordinate gate-in timing across containers to avoid triggering higher tariff rates for partial shipments.
The Capacity Glut and Its Impact on Rate Negotiations
The 8.3 million TEU orderbook represents 27% of the existing global fleet—a proportion that signals oversupply for at least 4–5 years (Source 8: Fleet Composition Analysis). When combined with demand growth of only 2.4%, the arithmetic is clear: carriers will operate at declining utilization rates unless capacity is removed through scrapping or slow-steaming.
Rate Negotiation Leverage: Shippers should reject the premise that rates are returning to pre-pandemic levels. The current environment is not a normalization; it is a structural shift. Carriers are deploying capacity that cannot be profitably filled at current demand levels. This creates a buyer’s market where contract rates should reflect marginal cost pricing rather than target returns on capital.
Spot Rate Implications: Spot rates corrected from July 2024 peaks (Source 9: Rate Correction Data). The correction trajectory suggests further softening as new vessel deliveries enter service through 2026. Shippers with volume commitments should negotiate flexible contract structures that allow for spot market participation when spot rates fall below contract rates.
Strategic Recommendations for 2026
- Front-load inventory before November 2026: shippers sourcing from China should accelerate procurement timelines to secure goods under the 29.3% tariff rate. This requires early engagement with logistics providers who have established presence across major Asian origin ports, including Hong Kong, Shanghai, Singapore, and Ho Chi Minh Port.
- Negotiate multi-year contracts: the capacity glut provides leverage for long-term rate agreements that protect against both tariff escalation and carrier rate increases. Contracts should include rate review clauses tied to industry benchmarks rather than carrier cost structures.
- Diversify route strategy: over-reliance on West Coast routing exposes shippers to rail cost volatility and port congestion. Developing alternative routing via Panama or Suez—or leveraging RIPI (Reverse Interior Point Intermodal) from East Coast ports—creates negotiation leverage against any single carrier or corridor.
- Integrate compliance into route planning: FMC and AMS requirements are not back-office functions; they directly impact rate realization. Shippers must ensure that filing protocols are synchronized with gate-in scheduling to avoid tariff rate applications that can add 30%+ to cargo costs.
The transpacific trade lane is entering a period where structural oversupply meets tariff uncertainty. Shippers who treat this as a tactical logistics challenge will underperform. Those who recognize the 2026 window as a strategic inflection point—combining capacity leverage with tariff arbitrage—will secure competitive advantage that extends beyond the current contract cycle.
Trade Metrics
Related Datasets
Q4 Cross-Border Logistics Report
PDF • 4.2 MB
Automotive Parts Supply Chain Index
CSV • 1.1 MB