Transpacific Trade Lane Guide 2026: Routes, Ports, Tariffs, and Capacity Outlook

Sarah Martinez
Logistics Correspondent
May 27, 2026
DATELINE: NA TRADE WIRE
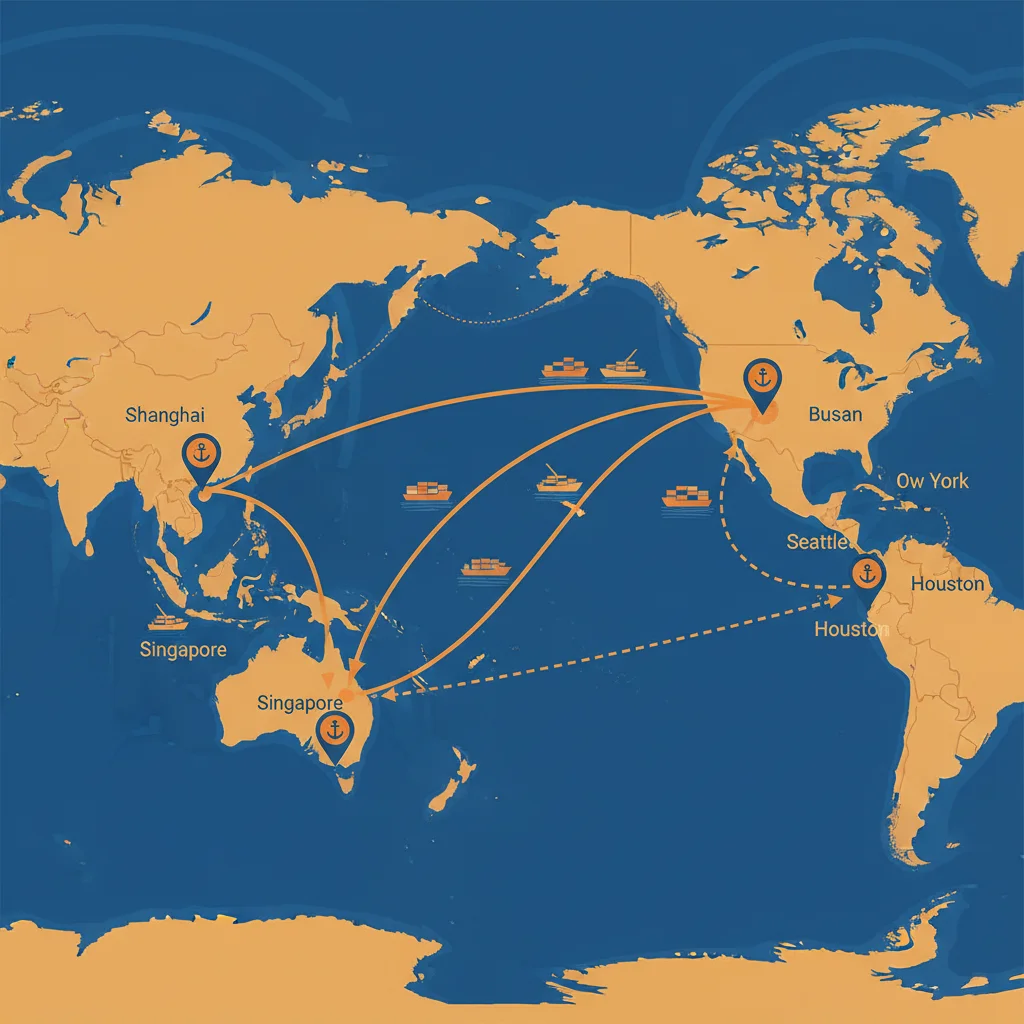
"This comprehensive guide examines the Asia-to-North America shipping landscape"
Transpacific Trade Lane Guide 2026: Routes, Ports, Tariffs, and Capacity Outlook
Introduction: The State of the Transpacific Trade Lane in 2026
The transpacific trade lane remains the world’s busiest deep-sea route, moving approximately 22 million TEUs annually between Asia and North America. As 2026 unfolds, shippers and logistics professionals face a landscape shaped by three powerful forces: an unprecedented capacity oversupply, a temporary truce window in US-China tariff escalation, and rapidly evolving routing strategies that shift cargo flows between the West Coast, Panama Canal, and Suez Canal corridors.
[IMAGE: Infographic showing total TEU volume with year-over-year trend line from 2024 to 2026, highlighting the 22 million TEU benchmark and projected growth]
The container shipping industry added 9.7% fleet capacity in 2024 alone, with annual growth projected at 8.7% through 2028—far outstripping demand growth of just 2.4%. This glut is reshaping rate negotiations, contract terms, and service reliability across the Asia to North America shipping corridor. Meanwhile, the effective US-China tariff rate has been temporarily reduced to 29.3% through November 2026, offering a strategic window for importers to optimize procurement and inventory strategies.
This guide provides a practical framework for navigating the transpacific trade lane in 2026, covering routing options, port selection, intermodal strategies, tariff implications, and capacity dynamics.
The Three Primary Routes: West Coast Direct, Panama Canal, Suez Canal
Asia to US West Coast Direct
The fastest option remains the direct route from major Asian ports to the US West Coast, with transit times of 10 to 14 days. This corridor serves the Pacific Southwest hubs—Los Angeles and Long Beach—and the Pacific Northwest gateways of Seattle and Tacoma. For cargo destined for inland markets west of the Rockies, this route offers speed and cost efficiency, though congestion at Southern California ports remains a seasonal risk, particularly during peak pre-holiday months.
[IMAGE: Map of the Pacific Ocean with three route lines highlighted in different colors: blue for West Coast direct, orange for Panama Canal, and green for Suez Canal]
Asia to US East Coast via Panama Canal
The Panama Canal route offers a 20- to 25-day transit and avoids West Coast congestion altogether, directly serving major East Coast ports such as New York, Savannah, Charleston, Norfolk, and Jacksonville. The canal’s recent capacity expansions—following drought-related restrictions in 2023–2024—have improved reliability, but shippers should monitor water levels and transit booking windows. This route is particularly advantageous for cargo destined for the Southeast and Mid-Atlantic regions, where inland trucking costs from West Coast ports can erode savings from faster ocean transit.
Asia to US East Coast via Suez Canal
The Suez Canal alternative has seen fluctuating usage due to geopolitical tensions in the Red Sea and Gulf of Aden. When the Panama Canal faces restrictions or when shippers want to avoid West Coast congestion entirely, the Suez route provides similar transit times (approximately 22–26 days) but introduces risks from Houthi attacks and potential rerouting around the Cape of Good Hope. In 2026, carriers are cautiously adding Suez services for East Coast cargo, but most remain committed to the Panama and West Coast options.
Routing decisions depend on three factors: cost per container, reliability of transit times, and inland distribution needs. Shippers should model total landed cost—including ocean freight, rail, trucking, and inventory carrying costs—for each route before committing to contract terms.
Key Ports: Origin and Destination Hubs
Major Asian Origin Ports
The transpacific trade lane originates from a diverse network of Asian load ports. Key hubs include:
- Northeast Asia: Busan (South Korea), Yokohama (Japan), Xingang, Qingdao, Shanghai, Ningbo (China)
- South China: Xiamen, Yantian, Shekou, Nansha
- Taiwan: Kaohsiung
- Southeast Asia: Singapore, Port Klang (Malaysia), Ho Chi Minh City and Haiphong (Vietnam), Laem Chabang (Thailand)
[IMAGE: Table listing key Asian origin ports with estimated annual throughput volumes and primary US destination routes]
Vietnam’s Haiphong and Ho Chi Minh City have grown rapidly as manufacturers shift production out of China to avoid tariff impacts, making them critical nodes in the North America trade routes logistics network. Singapore remains the primary transshipment hub for Southeast Asian cargo.
US Destination Ports
On the receiving end, US ports are grouped by coastal region:
- Pacific Northwest (PNW): Seattle and Tacoma offer fast rail connections to the Midwest and are less congested than Southern California.
- Pacific Southwest (PSW): Los Angeles and Long Beach handle the largest volume of containerized cargo, with extensive on-dock rail and massive warehousing capacity.
- East Coast: New York/New Jersey, Norfolk, Savannah, Charleston, and Jacksonville serve the densely populated eastern seaboard.
- Gulf Coast: Houston and Mobile (with growing capacity in Miami) provide alternatives for cargo destined for Texas and the interior South.
Port selection is influenced by proximity to inland rail hubs, local congestion levels, infrastructure investments (e.g., Savannah’s deepening project, LA/LB’s terminal automation), and labor stability. In 2026, West Coast ports have regained reliability following the 2023 labor contract ratification, but East Coast ports continue to capture market share due to population shifts toward the Sun Belt.
Intermodal Options: IPI and RIPI for Inland Distribution
Once containerized cargo arrives at a US gateway, shippers must choose how to move it inland. Two primary intermodal strategies dominate the intermodal logistics landscape:
Interior Point Intermodal (IPI)
Under IPI, cargo arrives at a West Coast port and is then moved by rail or truck to inland destinations. Common IPI destinations include Chicago, Dallas, Memphis, Kansas City, and Denver. This strategy maximizes the speed advantage of the West Coast route: a container from Shanghai can reach Chicago in approximately 14–16 days total (10 days ocean + 4–6 days rail).
IPI rates are typically based on the container’s gate-in date at the origin port, and for multiple containers under the same bill of lading, the rate applies to the latest gate-in date. Shippers should carefully coordinate stuffing schedules to avoid demurrage and detention charges.
Reverse Interior Point Intermodal (RIPI)
RIPI reverses the flow: cargo arrives at an East Coast or Gulf Coast port and moves westward or to interior hubs. For example, containers discharged at Savannah can be railed to Atlanta, Memphis, or even Dallas and Chicago. RIPI is increasingly attractive for importers serving the Southeast and Midwest because it avoids West Coast congestion and leverages the growing rail capacity of East Coast ports.
The choice between IPI and RIPI depends on:
- Final destination: IPI is faster and cheaper for Midwest cargo when using West Coast ports; RIPI works best for Southeast and South-Central destinations.
- Transit time requirements: IPI via West Coast can shave 3–5 days off total door-to-door time for Midwest destinations compared to RIPI via East Coast.
- Rail capacity and cost: Rail rates fluctuate with fuel and demand; shippers should request quotes for both options in contract negotiations with carriers and rail providers.
[IMAGE: Diagram showing IPI flow from West Coast ports to inland hubs and RIPI flow from East Coast/Gulf ports to interior, with arrows and labels for key destinations]
Tariffs and Regulatory Landscape in 2026
The temporary reduction of US-China tariffs to an effective rate of 29.3% (down from prior peak levels) represents a significant shift for US China tariffs 2026. This window, effective through November 2026, provides importers with an opportunity to restructure supply chains and reduce landed costs. However, the tariff reduction applies only to certain product categories and requires careful documentation to ensure correct classification.
Shippers must remain vigilant about regulatory compliance:
- FMC Filing: All ocean transportation intermediaries and NVOCCs must file tariffs and negotiate service contracts with the Federal Maritime Commission, ensuring transparent rate structures.
- AMS (Automated Manifest System): Cargo manifests must be submitted 24 hours before loading at origin ports to comply with US Customs and Border Protection security requirements.
- TPEB Contract Cycles: The Transpacific Eastbound (TPEB) contract season—typically from late March through May—determines annual rates and service commitments. In 2026, the capacity glut is pushing rates down, making spot market alternatives more attractive for shippers who can tolerate some risk.
Capacity Outlook: Glut, Rate Pressure, and Strategic Implications
The container shipping capacity situation is the defining factor of the 2026 market. The fleet expansion of 9.7% in 2024—driven by massive newbuild orders placed during the pandemic-era rate boom—is projected to continue at 8.7% annual growth through 2028. This far exceeds demand growth of approximately 2.4%, resulting in persistent overcapacity.
Carriers are responding by:
- Idling vessels or demolishing older tonnage
- Reducing service frequency on some trades
- Offering aggressive spot and contract rates to secure market share
For shippers, this creates a buyer’s market. Multi-year contracts with favorable escalator clauses, volume flexibility, and free-time allowances are negotiable. However, shippers should not assume low rates will persist indefinitely. Geopolitical shocks (e.g., Red Sea disruptions, Panama Canal restrictions) can quickly tighten capacity and spike rates.
Conclusion: Practical Recommendations for Shippers
The transpacific trade in 2026 is defined by abundance—of capacity, of routing options, and of negotiation leverage. To optimize costs and reliability, shippers should:
- Model total landed cost for all three routes (West Coast direct, Panama, Suez) and both intermodal strategies (IPI, RIPI) for their specific destinations.
- Lock in long-term rates during the TPEB contract season, but maintain a sufficient spot market allocation to capture further declines.
- Monitor tariff developments closely—the 29.3% effective rate is temporary; planning for a potential increase after November 2026 is critical.
- Diversify ports of entry to avoid congestion and labor disruptions, balancing West Coast speed with East Coast/Gulf reliability.
- Invest in supply chain visibility tools to track container gate-in dates, rail departures, and customs clearance in real time.
The 2026 transpacific trade lane is ripe with opportunity for informed shippers. By understanding the interplay of routes, ports, tariffs, and capacity, logistics professionals can turn the current market dynamics into a competitive advantage.
---
This guide was prepared for logistics professionals and supply chain executives. Data sourced from Drewry, Alphaliner, and FMC filings as of Q1 2026.
Trade Metrics
Related Datasets
Q4 Cross-Border Logistics Report
PDF • 4.2 MB
Automotive Parts Supply Chain Index
CSV • 1.1 MB