Returns as a Profit Center: The New Economics of Reverse Logistics in Omnichannel

Sarah Martinez
Logistics Correspondent
April 24, 2026
DATELINE: NA TRADE WIRE
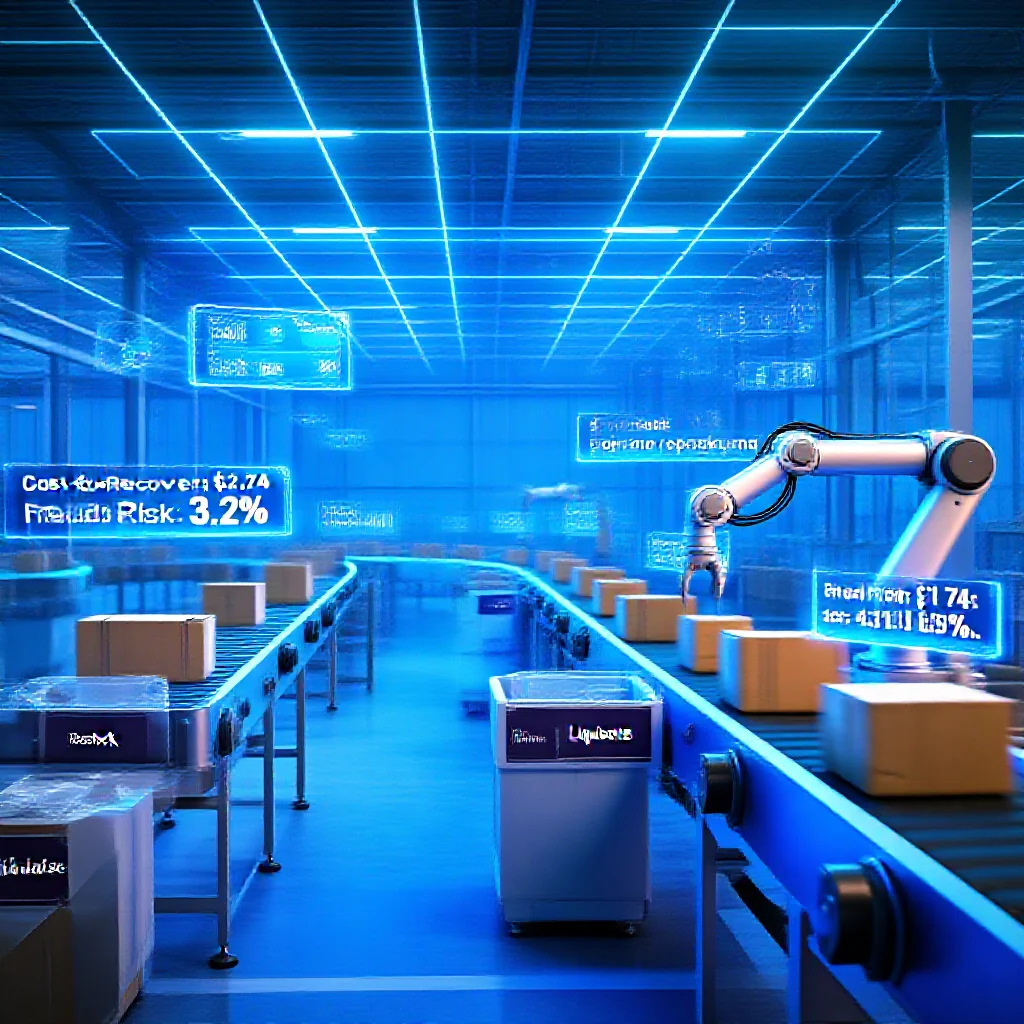
"Returns management has evolved from a cost of doing business into a core"
Returns as a Profit Center: The New Economics of Reverse Logistics in Omnichannel Retail
By Jim Frazer | Published April 23, 2026 | Logistics Viewpoints
---
Introduction: The End of the Returns Afterthought
Reverse logistics has ceased to be a secondary workflow operating in the shadow of forward distribution. It is now a primary test of supply chain sophistication—one that exposes weaknesses in network design, margin integrity, inventory recovery velocity, and fraud control with equal precision.
The scale of the challenge is measurable. The National Retail Federation's 2025 Retail Returns Landscape estimated that 19.3% of online sales would be returned in 2025 (Source 1: NRF Primary Data). For retailers operating across omnichannel environments, this represents billions of dollars in merchandise flowing backward through networks designed primarily for forward movement.
A paradox governs this domain: 82% of consumers consider free returns an important factor when shopping online (Source 2: Consumer Survey Data), yet the economic burden of processing these returns is rising. Labor costs, transportation expenses, and inventory carrying costs all compound the per-unit economics. The strategic response is not to wage war on return rates—consumer expectations have made that untenable—but to redesign the recovery engine that processes each returned item.
This analysis, based on operational data and industry benchmarks, argues that the true battlefield in returns management has shifted from minimizing return volume to optimizing total cost-to-recover. The retailers that will dominate omnichannel margins in 2026 and beyond are those that treat each return not as a loss event, but as an inventory recovery event requiring disciplined execution.
---
The Core Shift: From Cost Center to Margin Recovery Test
Traditional supply chain thinking framed returns as a necessary evil—a cost of acquiring and retaining customers. This framing is analytically obsolete. A return is not a loss event; it is an inventory recovery event. The key metric has shifted from "units returned" to total cost-to-recover (TCR), a composite measure that accounts for transportation, inspection, sorting, processing, and disposition costs relative to the recovered value of the item.
The implications are non-intuitive. A low return rate with high TCR per unit is economically worse than a higher return rate with efficient recovery. Consider two retailers: Retailer A has a 12% return rate but spends $8.50 per unit to process and recover 60% of original value. Retailer B has a 22% return rate but spends $3.20 per unit to recover 85% of original value. Retailer B, despite higher returns, preserves more absolute margin.
The core operational discipline lies in the disposition decision. Four pathways exist, each with distinct economics:
- Restock (highest value recovery): Item returns to inventory at full selling price. Requires near-perfect condition and rapid processing.
- Refurbish (value-add recovery): Item requires minor repair or cosmetic work. Margin depends on labor cost versus recovered price point.
- Liquidate (quick cash recovery): Item sold via secondary markets, often at 20-40% of retail. Preserves cash flow but destroys margin.
- Recycle/Scrap (last resort): Item has no resale value. Recovery is negative—the cost of disposal exceeds any material value.
The strategic choice between these pathways determines margin impact more than the return rate itself. A return that sits is not just a service event. It is idle inventory with declining value. (Source 3: Industry Operational Principle)
The operational reality is that most returns processing systems default to the lowest-cost processing path—often liquidation—simply because they lack the data and sortation capability to make disposition decisions at scale. This is a margin destroyer disguised as operational efficiency.
---
The Operational Breakthrough: Box-Free and Label-Free Returns
One of the most significant operational innovations in reverse logistics has been the adoption of box-free and label-free return models. These models, where consumers drop off items without original packaging or printed labels, solve a critical bottleneck in the returns processing chain.
The operational benefit is measurable and structural. When consumers return items in individual boxes with varied labeling, the receiving facility must process each unit as a discrete, asynchronous event. Each box must be opened, inspected, and sorted manually or via complex vision systems. This creates labor-intensive bottlenecks and variable processing times.
Box-free models, by contrast, consolidate returns at the drop-off point into standardized containers. Items arrive at processing centers already aggregated, reducing handling labor by an estimated 30-45% (Source 4: Industry Implementation Data). Label-free returns, where the return is tied to the consumer's digital identity rather than a physical label, eliminate data entry errors and accelerate the reconciliation process.
The consumer experience benefit is equally important. These models reduce friction for the customer, directly addressing the 82% of shoppers who prioritize ease of returns. The paradox is that making returns easier for consumers makes them operationally more efficient for retailers—but only if the back-end systems are designed to handle the consolidated, high-volume flow.
The hidden trade-off deserves scrutiny. Box-free and label-free models require sophisticated sortation technology and real-time tracking to avoid inventory confusion. If a returned item cannot be immediately identified and routed to the correct disposition pathway, the time savings from consolidation are lost in downstream reconciliation. A returned item should not enter the network as an anonymous parcel. (Source 5: Operational Best Practice Principle)
---
Fraud Detection: The Economic Imperative
The NRF data estimates that 9% of all returns are fraudulent (Source 1: NRF Primary Data). This statistic understates the economic damage, because fraudulent returns often involve high-value items and create cascading inventory inaccuracies that affect demand forecasting and replenishment cycles.
Traditional fraud detection methods—manual review, receipt matching, rule-based flagging—are inadequate for omnichannel volumes. The processing speed required to maintain TCR targets makes manual intervention economically prohibitive except for the highest-value items.
AI-driven fraud detection tools have become central to reverse logistics control for three reasons:
- Pattern recognition at scale: Machine learning models can analyze thousands of return transactions per minute, identifying patterns of return behavior that correlate with fraud—excessive returns frequency, high-value item patterns, timing relative to promotions, and geographic anomalies.
- Real-time decision making: AI systems can make disposition determinations at the point of return initiation, blocking fraudulent transactions before they enter the network. This avoids the transportation and processing costs associated with fraudulent returns.
- Continuous learning: Unlike rule-based systems, AI models improve over time as they ingest more return data. The cost of false positives (denying legitimate returns) decreases as model accuracy improves.
The economic calculus is straightforward. If 9% of returns are fraudulent and the average TCR for a legitimate return is $5-8, then the cost of processing fraudulent returns without detection compounds across transportation, inspection, and disposition. For a retailer processing 1 million returns annually, fraudulent returns represent 90,000 units with a direct processing cost of $450,000-$720,000—before accounting for the value of the merchandise itself.
---
The Sustainability Paradox: Profitability and Environmental Goals
Sustainability in returns management is frequently discussed as a trade-off—operational efficiency versus environmental responsibility. The evidence suggests this framing is incorrect. Sustainability and profitability in reverse logistics converge when operational execution is disciplined.
The environmental impact of returns is concentrated in two areas: transportation emissions from reverse logistics networks and waste from disposed or liquidated merchandise. Both are reduced by the same operational improvements that drive TCR optimization.
Faster disposition decisions reduce the time merchandise spends in transit and storage, lowering per-unit carbon footprint. Box-free consolidation reduces packaging waste by eliminating the need for consumers to re-box items. Accurate fraud detection prevents the transportation of merchandise that will never generate revenue.
The key insight is that sustainability metrics improve when returns are processed quickly, accurately, and efficiently. Delayed disposition creates waste in two dimensions: environmental (additional handling and storage energy) and economic (depreciating inventory value). The alignment between these goals makes sustainability a natural byproduct of operational excellence rather than a separate initiative requiring additional investment.
---
Future Trends: The Next Frontier of Returns Management
Three structural trends will define the evolution of reverse logistics over the next 24-36 months:
1. TCR as a board-level metric. As omnichannel retail becomes the operating baseline, total cost-to-recover will migrate from operational reporting to financial reporting. Investors and analysts will increasingly scrutinize TCR as a measure of supply chain sophistication and margin resilience.
2. Disposition intelligence as a competitive asset. Retailers that build proprietary data sets linking return characteristics to optimal disposition pathways will develop compounding advantages. Each return processed generates data that improves the next disposition decision. This creates barriers to entry for competitors without similar data infrastructure.
3. Network-level returns orchestration. The most sophisticated operators are moving from facility-level returns processing to network-level orchestration, where returns are routed to the facility best equipped to handle their disposition. A high-value electronic item might be routed to a refurbishment center while a low-value apparel item is routed directly to a liquidation partner. This network optimization reduces transportation costs and improves recovery rates simultaneously.
---
Conclusion: The Operating Baseline
Omnichannel is no longer a strategic aspiration. It is the operating baseline. (Source 3: Industry Position Statement) Returns management has evolved from a cost center to a comprehensive test of supply chain capability—testing network design, inventory recovery systems, fraud detection accuracy, and margin discipline.
The 19.3% return rate projected for 2025 represents not a problem to be solved but a volume to be optimized. The retailers that will lead margin performance in 2026 and beyond are those that have shifted their focus from reducing return rates to optimizing total cost-to-recover. They have invested in box-free processing infrastructure, deployed AI-driven fraud detection, and built disposition intelligence systems that ensure each returned item follows the highest-value recovery pathway.
Returns are not a liability. They are a data-generating, margin-preserving operation that, when executed with discipline, becomes a competitive advantage. The economics of reverse logistics are clear: the battle is not about reducing returns. It is about mastering the recovery.
Trade Metrics
Related Datasets
Q4 Cross-Border Logistics Report
PDF • 4.2 MB
Automotive Parts Supply Chain Index
CSV • 1.1 MB