Mapping North America''s Top 15 Freight Hubs: The 2024 Trade Data and What

Sarah Martinez
Logistics Correspondent
May 18, 2026
DATELINE: NA TRADE WIRE
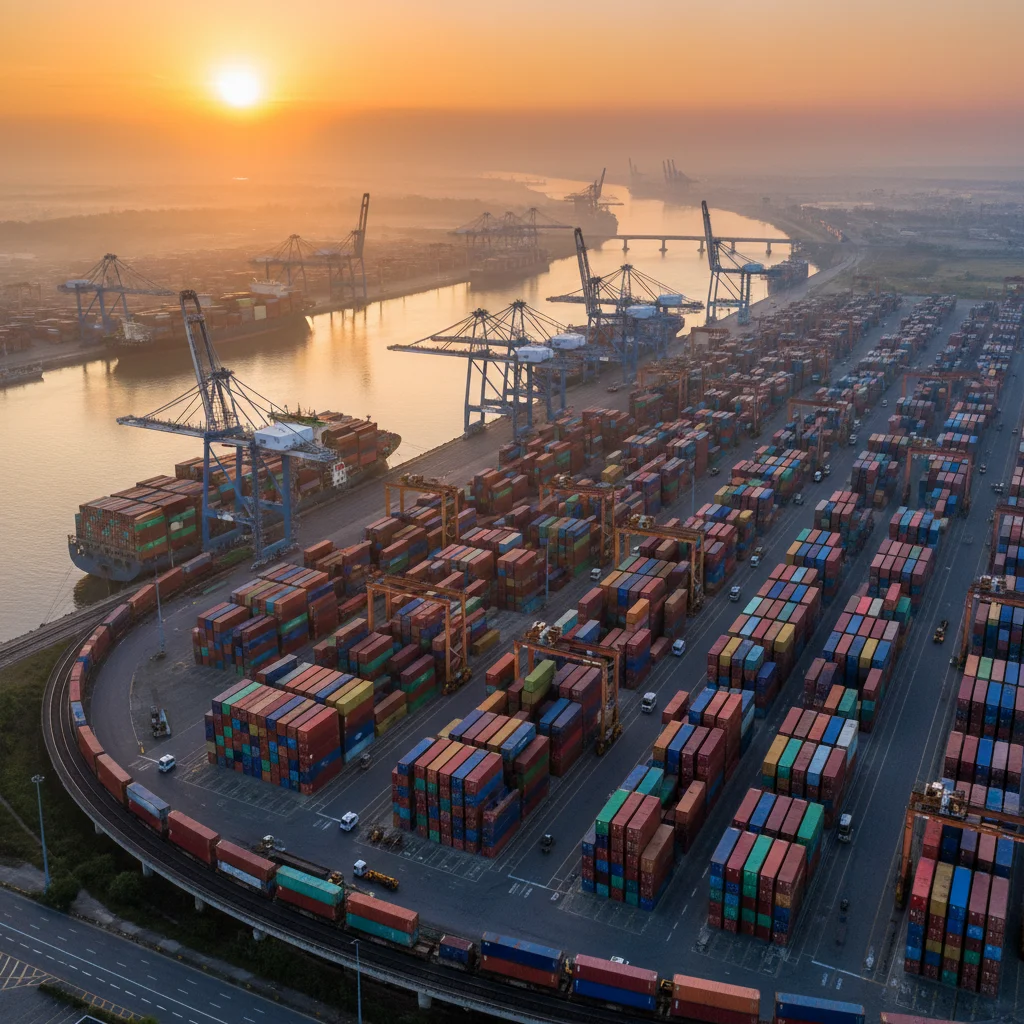
"In 2024, North America's 15 busiest freight ports collectively handled over"
Mapping North America's Top 15 Freight Hubs: The 2024 Trade Data and What It Means for Logistics
Introduction: The 54-Million TEU Milestone
In 2024, North America’s 15 busiest freight ports collectively handled more than 54 million twenty-foot equivalent units (TEUs), a figure that underscores the immense scale of continental trade and the growing complexity of supply chain operations. The Port of Los Angeles alone moved nearly 9.4 million TEUs, setting a new benchmark for port capacity and efficiency in the region. This data, derived from the American Journal of Transportation and visualized by Visual Capitalist in partnership with Greenbrier Companies, provides a critical lens through which to analyze shifting trade routes, infrastructure demands, and the strategic priorities that will shape logistics for years to come.
The volume of containerized cargo passing through these hubs reflects not only the health of the North American economy but also the evolving geography of global supply chains. From the dominant West Coast gateways to the rapidly expanding East Coast and Gulf alternatives, each port tells a story of investment, congestion, adaptation, and innovation. For supply chain managers, policymakers, and investors, understanding which ports are absorbing the greatest share of trade—and how they connect to inland markets—is essential to making informed decisions about routing, capacity planning, and infrastructure spending.
[IMAGE: Map of North America with top 15 port locations highlighted, showing major trade corridors connecting ports to inland rail networks]
West Coast Dominance: Los Angeles and Long Beach
The San Pedro Bay complex, comprising the Port of Los Angeles and the Port of Long Beach, remains the undisputed gateway for Asian imports into North America. In 2024, these two ports processed a combined total of over 18 million TEUs—more than the next three largest ports on the continent combined. The Port of Los Angeles reported 9,375,735 TEUs for the full calendar year, while the Port of Long Beach recorded 8,788,718 TEUs through November, placing it on pace to finish the year near 9.5 million TEUs as well.
Several factors underpin this enduring dominance. First, Southern California’s proximity to Asia makes it the natural first landfall for vessels crossing the Pacific. Second, the region’s massive consumer market—home to over 22 million people in the Greater Los Angeles area—absorbs a significant share of imports directly. Third, and perhaps most critically, both ports benefit from extensive on-dock rail facilities that allow containers to move directly from ship to train without intermediate truck trips. This rail integration is a key differentiator, reducing congestion and enabling faster inland distribution to cities like Chicago, Dallas, and Memphis.
However, the West Coast’s supremacy is not without challenges. Labor negotiations, infrastructure bottlenecks, and rising costs have periodically pushed shippers to explore alternative routes. Nevertheless, the sheer scale of throughput at Los Angeles and Long Beach means that any disruption at these ports reverberates across the entire North American supply chain.
[IMAGE: Large containership docked at the Port of Los Angeles with downtown skyline visible in the background, cargo cranes unloading containers]
East Coast and Gulf Rivals: New York/New Jersey, Savannah, Houston
While the West Coast still commands the largest share of containerized trade, the East Coast and Gulf ports have been gaining ground, driven by the expansion of the Panama Canal, nearshoring trends, and a strategic desire to diversify supply chain risk. The Port of New York and New Jersey, with 7,290,743 TEUs through October, remains the busiest East Coast hub and serves the densely populated Northeast corridor, a market of more than 50 million consumers. Its ability to handle ultra-large container vessels after the Bayonne Bridge raising project has cemented its role as a primary alternative to West Coast gateways.
But it is the ports of Savannah and Houston that are posting the most dramatic growth. Savannah handled 5,103,417 TEUs from January to November, a testament to its efficient Garden City Terminal and its heavy investment in intermodal rail connections. The Port of Houston, meanwhile, processed 3,799,573 TEUs over the same period, benefiting from the energy sector’s demand for equipment and materials as well as the broader reshoring of manufacturing activity to the U.S. South and Mexico.
These ports are not merely passive beneficiaries of shifting trade flows. They have invested heavily in channel deepening, berth expansion, and on-dock rail to compete with the West Coast. Savannah’s Savannah Harbor Expansion Project, for example, deepened the shipping channel to 47 feet, allowing it to accommodate the largest container vessels now transiting the Panama Canal. Houston’s Bayport Container Terminal continues to add new cranes and storage capacity. The result is a more balanced continental network—one in which shippers have viable alternatives that can reduce transit times to inland destinations in the Midwest and Southeast by several days.
[IMAGE: Port of Savannah's Garden City Terminal showing neat rows of colorful containers, rail lines running alongside, and multiple ship-to-shore cranes]
Canadian and Pacific Northwest Ports: Vancouver, Seattle-Tacoma
Further north, the ports of Vancouver and Seattle-Tacoma form a critical corridor for trade flowing between Asia and the interior of both Canada and the United States. The Port of Vancouver processed 3,200,415 TEUs through November, making it Canada’s busiest and most strategically important Pacific gateway. Much of this cargo is destined for the Canadian prairies and the U.S. Midwest via Canada’s two major railways, Canadian National (CN) and Canadian Pacific Kansas City (CPKC).
The Northwest Seaport Alliance (NWSA), encompassing the ports of Seattle and Tacoma, recorded 3,035,986 TEUs over the same period. While smaller than its southern California counterparts, the NWSA offers a crucial alternative for shippers looking to bypass congestion at Los Angeles/Long Beach and still reach major inland hubs like Chicago and Memphis via transcontinental rail—often with faster transit times than through the Panama Canal route.
However, both Vancouver and Seattle-Tacoma face significant capacity constraints. Vancouver’s Deltaport and Centerm terminals operate near full utilization, and the port has launched the Gateway Program to expand berth space and improve road and rail access. Seattle-Tacoma is similarly investing in terminal upgrades and deepening channels. The challenge is that demand continues to outpace infrastructure investment, leading to periodic congestion and dwell-time increases. For shippers, these ports remain valuable but require careful planning, particularly during peak seasons.
[IMAGE: Port of Vancouver with coastal mountains in the background, container cranes unloading a vessel, and stacks of containers visible]
The Unsung Hero: Rail Infrastructure as the Backbone
None of these port volumes would be sustainable without the rail networks that move containers inland. Rail integration is the unsung hero of North American logistics, transforming coastal ports from endpoints into nodes in a vast continental distribution system. The Class I railroads—BNSF Railway, Union Pacific, CPKC, and Norfolk Southern—together operate tens of thousands of miles of track, hauling double-stack container trains from every major port to inland hubs such as Chicago, Kansas City, Memphis, Dallas, and Toronto.
The importance of rail becomes clear when considering the scale: a single double-stack train can carry the equivalent of 280 truckloads, reducing highway congestion, fuel consumption, and carbon emissions. At the Port of Los Angeles, over 30% of all containers are moved by on-dock rail directly to inland points, a figure that rises to nearly 40% at the Port of Long Beach. In Savannah, the port’s on-dock rail facility—the largest in North America—handles roughly 1.5 million container lifts annually by rail alone.
The partnership with Greenbrier Companies, a leading manufacturer of railcars, highlights the critical role of equipment innovation in supporting port throughput. Greenbrier’s lightweight double-stack railcars, along with advanced railcar tracking and maintenance technologies, allow railroads to increase capacity per train and reduce downtime. As ports continue to handle record volumes, the ability to efficiently move those containers off the dock and onto trains becomes a competitive differentiator—and a bottleneck if not properly managed.
[IMAGE: A long double-stack container train crossing a high bridge over a river, with the silhouette of a port in the distant background]
Conclusion: Implications for Supply Chain Strategies
The 2024 freight port data reveals a North American trade landscape that is both resilient and evolving. The West Coast remains the heavyweight champion, but the East Coast and Gulf ports are closing the gap, driven by infrastructure investments and structural shifts in trade patterns. Canadian and Pacific Northwest ports provide essential alternatives, though capacity constraints demand careful attention.
For supply chain managers, the key takeaway is the growing importance of multimodal flexibility. Relying on a single port or corridor is increasingly risky. Instead, successful logistics strategies will incorporate a diversified portfolio of gateways, supported by robust rail connections that can shift volumes quickly when one route faces disruption.
For policymakers, the data underscores the urgent need for continued investment in port infrastructure, channel deepening, and intermodal rail capacity. The 54 million TEUs handled in 2024 is a benchmark, not a ceiling—and without proactive expansion, congestion will tighten margins and raise costs for consumers.
For investors, the trends point toward continued opportunities in port-related real estate, railcar manufacturing (like Greenbrier), and logistics technology companies that improve visibility and efficiency across the supply chain. As North America’s trade routes evolve, those who understand the interplay between port capacity, rail integration, and demand growth will be best positioned to navigate the logistics landscape of tomorrow.
[IMAGE: Infographic showing a simplified timeline of port volume growth from 2020 to 2024 for the top 5 ports, with an upward trend line]
Trade Metrics
Related Datasets
Q4 Cross-Border Logistics Report
PDF • 4.2 MB
Automotive Parts Supply Chain Index
CSV • 1.1 MB