The Hidden Grid: How North America’s Legacy Waterways and Railways Still Shape

Sarah Martinez
Logistics Correspondent
May 2, 2026
DATELINE: NA TRADE WIRE
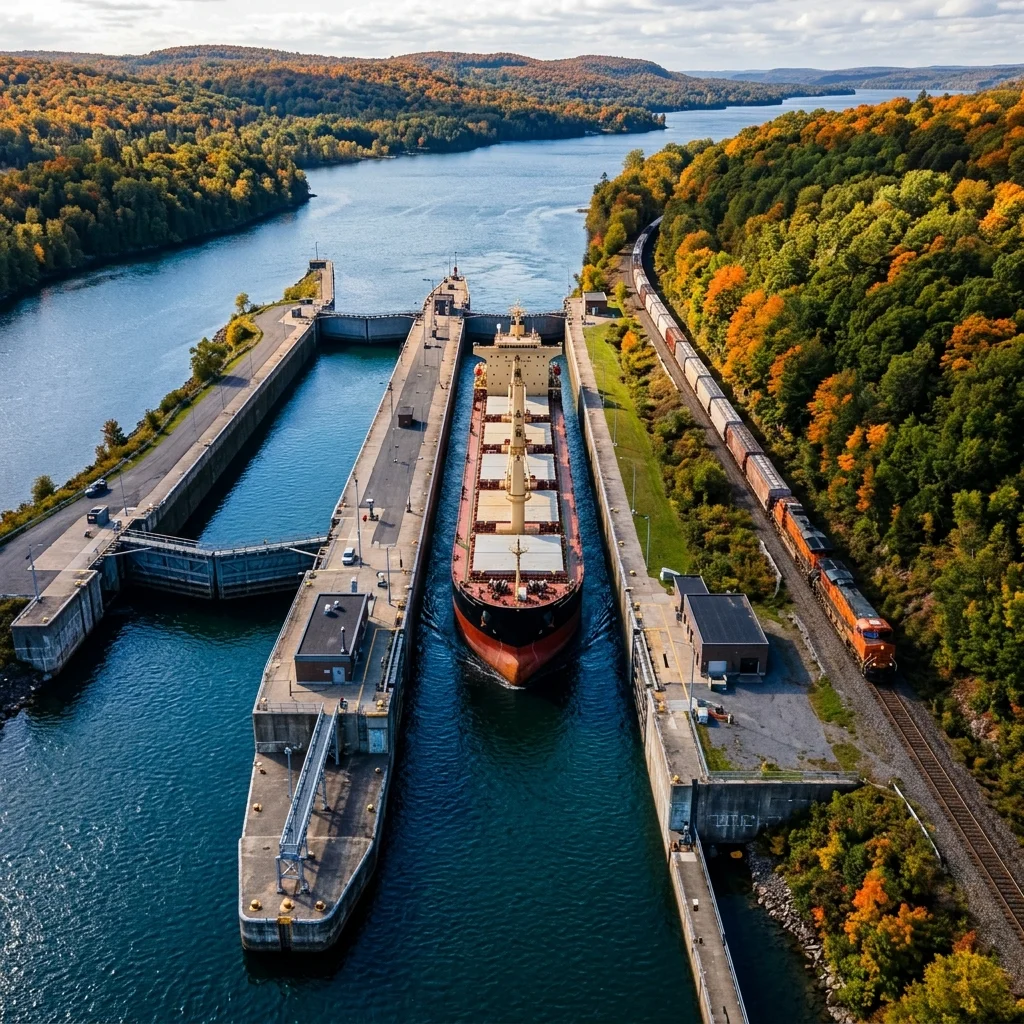
"While modern logistics focuses on highways and digital freight, the foundational"
The Hidden Grid: How North America’s Legacy Waterways and Railways Still Shape Today’s Trade Routes and Logistics
Subtitle: An examination of how 19th- and 20th-century infrastructure investments continue to dictate 21st-century supply chain economics
---
Introduction: The Ghost Lines of Modern Logistics
The contemporary logistics industry directs substantial capital toward last-mile delivery automation, electric vehicle fleets, and digital freight platforms. Yet the fundamental architecture of North American freight movement—the corridors that determine warehouse locations, fuel costs, and shipping rates—remains anchored to physical pathways established before the internal combustion engine achieved commercial viability. This paradox reveals a durable economic geography: the water routes traversed by indigenous watercraft and the rail corridors blasted through mountain passes in the 1800s continue to function as the continent’s primary freight arteries.
The cleaned fact set underlying this analysis demonstrates consistent patterns: the Gulf of St. Lawrence, Hudson Strait, Chesapeake Bay, and Gulf of Mexico were not arbitrary entry points but low-energy access routes that determined port city hierarchies. The Mississippi-Ohio and Great Lakes–St. Lawrence systems formed a Y-shaped super-corridor into the continental interior. These 19th-century infrastructure decisions—canal dredging, lock construction, rail land grants—created permanent cost structures that modern logistics operators must navigate as fixed constraints, not historical curiosities.
---
1. Waterways: The Original Supply Chain Operating System
North America’s natural waterway network provided the continent’s first scalable transportation system. The routes up the Gulf of St. Lawrence, Hudson Strait, Chesapeake Bay, and the Gulf of Mexico permitted the development of coastal ports and opened up the continental interior (Source: Historical Transportation Geography). These were not random access points; they represented the lowest-energy pathways into a landmass defined by the Appalachian and Cordilleran mountain ranges and the massive interior drainage basin of the Mississippi River system.
The Mississippi-Ohio and Great Lakes–St. Lawrence waterways drew navigation into the heartland of North America, creating a Y-shaped corridor that reduced overland haul costs by orders of magnitude compared to wagon transport (Source: Pre-Railroad Freight Economics). A single barge on the Mississippi River system can move one ton of cargo 576 miles on one gallon of fuel; the equivalent truck transport achieves approximately 145 miles per gallon per ton. This efficiency ratio, rooted in the physics of water displacement versus rolling friction, remains fundamentally unchanged despite a century of engine improvements.
The St. Lawrence Seaway as Infrastructure Archetype
The St. Lawrence Seaway constitutes the most dramatic example of waterway infrastructure overcoming natural barriers. The system overcame the Lachine Rapids near Montreal, the International Rapids along the U.S.-Canada border, and Niagara Falls—a vertical drop of approximately 167 feet (Source: Seaway Engineering Records). These three obstacles, each requiring different engineering solutions (canals with multiple locks, power generation diversions, and the Welland Canal’s eight locks), transformed Chicago and Duluth into functional ocean ports.
The economic logic was straightforward: before the Seaway’s completion in 1959, grain from the Canadian prairies and iron ore from the Mesabi Range required rail transport to Atlantic ports, then transshipment to ocean vessels. The Seaway eliminated one entire transshipment node, reducing handling costs by an estimated 15-25% per ton for bulk commodities (Source: St. Lawrence Seaway Authority Historical Cost Data). Today, the Seaway still moves approximately 40 million metric tons annually, primarily bulk commodities including iron ore, coal, grain, and petroleum products.
Modern Intracoastal and Connecting Routes
The Chicago Sanitary and Ship Canal links the Illinois River with Lake Michigan, creating a direct water connection between the Great Lakes and the Mississippi River system (Source: U.S. Army Corps of Engineers). This canal, completed in 1900, reversed the flow of the Chicago River and created an all-water route from the Gulf of Mexico to the Atlantic via the Great Lakes and Erie Canal.
The Erie Canal connects to the Mohawk-Hudson waterway, providing the only water-level passage through the Appalachian Mountains (Source: New York State Canal Corporation). Though diminished from its 19th-century peak, the Erie Canal still moves approximately 200,000 tons annually, primarily aggregates and construction materials.
The Intracoastal Waterway extends to river ports of the Gulf of Mexico, creating a protected inland route from Brownsville, Texas, to Apalachee Bay, Florida, and continuing along the Atlantic Coast to Norfolk, Virginia (Source: U.S. Army Corps of Engineers Navigation Data). This route handles approximately 80 million tons annually, dominated by petroleum products, chemicals, and building materials.
---
2. Railways: Speed, Land Grants, and the Conquest of Gravity
Railways developed from bases along the Atlantic Seaboard, representing a fundamental technological shift from water-dependent transport (Source: Railroad Development Chronology). While waterways moved bulk commodities slowly but cheaply, railways offered speed, direct routing, and year-round reliability—particularly important during winter months when northern waterways froze.
The rail-water tension defined North American transport economics: railways could not match water’s per-ton-mile cost for bulk commodities, but they could reach destinations unreachable by water and deliver goods in days rather than weeks. This trade-off created the multimodal system that persists today, with barges handling heavy, time-insensitive commodities and railways capturing higher-value, time-sensitive freight.
Route Selection: Exploiting Natural Gaps
Railways used gaps through the Appalachians and reached the Great Lakes or Ohio River at Buffalo, Chicago, and Pittsburgh (Source: Transportation Geography Analysis). These were not arbitrary locations; they represented the lowest-elevation passages through the mountain barrier separating the Atlantic seaboard from the interior. The Mohawk Valley (used by the New York Central), the Cumberland Gap (used by the Baltimore and Ohio), and the Pittsburgh gateway (used by the Pennsylvania Railroad) became permanent infrastructure chokepoints.
Railways reached the Mississippi River at St. Louis and St. Paul–Minneapolis, Minnesota, establishing transshipment points where rail and barge networks intersected (Source: Railroad Terminal Records). These locations became inland ports that remain among the busiest in North America for certain commodity classes.
Railways crossed the Great Plains and utilized passes through the Cordilleras to build terminals at San Francisco, Seattle, and Los Angeles (Source: Transcontinental Railroad Engineering Documents). The choice of passes—Donner Pass (Union Pacific), Marias Pass (Great Northern), Raton Pass (Santa Fe)—determined maximum train lengths, grades, and operational costs. These selection decisions, made in the 1860s-1880s, continue to affect route efficiency; a 1% grade increase on a heavy-haul railway reduces fuel efficiency by approximately 10-15%.
The Land-Grant Subsidy and Its Legacy
Most Western railways were given large land grants to encourage settlement (Source: U.S. Government Land Grant Records, 1850-1871). The Pacific Railway Act of 1862 granted the Union Pacific and Central Pacific 10 square miles of land for every mile of track laid, alternating in checkerboard patterns along the right-of-way. This created a permanent ownership structure that influences real estate values, mineral rights, and corridor pricing today.
The land-grant system also created a unique pricing incentive: railways were required to transport government freight at reduced rates, effectively subsidizing Western settlement and trade development. This structure produced the low promotional rates on long-haul traffic that developed transcontinental trade (Source: Interstate Commerce Commission Rate Case Records). The volume-discount pricing model pioneered in the 1870s for transcontinental shipments is the direct ancestor of modern intermodal and unit-train pricing, where per-ton costs decrease dramatically with shipment volume.
The Canadian Transcontinental System
In Canada, transcontinental railways linked the Maritime Provinces with the St. Lawrence–Great Lakes region (Source: Canadian Railway Historical Records). The Intercolonial Railway (eventually part of the Canadian National system) provided an all-rail connection between Halifax and Montreal, reducing dependence on the winter-freeze-prone St. Lawrence River.
Canadian railways crossed the Canadian Shield from Montreal and Toronto to converge at Winnipeg (Source: Canadian Pacific Railway Construction Documents). The shield’s rocky terrain and numerous lakes required extensive rock excavation, bridge construction, and circuitous routing. Winnipeg’s position at the convergence of the east-west rail lines and the north-south Red River water route created Canada’s primary inland transport hub—a status it retains for grain movement.
---
3. The Persistent Economic Geography: How 19th-Century Decisions Dictate 21st-Century Costs
The water and rail infrastructure built between 1825 (Erie Canal completion) and 1885 (Canadian Pacific Railway completion) created cost structures that cannot be replicated at modern construction prices. The Erie Canal cost approximately $7 million (1825 dollars), equivalent to roughly $200 million today. Constructing a comparable waterway through Appalachian terrain today would cost between $5-10 billion, making economic return impossible for most commodity flows (Source: Modern Infrastructure Cost Estimation).
This cost disparity creates permanent competitive advantages for locations along legacy corridors. A warehouse in Chicago’s South Side industrial corridor has access to five Class I railroads, the Chicago Sanitary and Ship Canal, and I-55—a multimodal density developed over 150 years. Constructing equivalent infrastructure in a greenfield location would require hundreds of billions in public and private investment.
Bottleneck Formation and Infrastructure Aging
Legacy infrastructure also creates bottlenecks. The St. Lawrence Seaway’s locks are designed for ships no longer than 740 feet (Panamax dimensions from the 1950s). Modern ocean vessels exceed 1,200 feet, meaning the Seaway cannot accommodate the largest container ships. This constraint forces transshipment at Montreal, reducing the Seaway’s competitiveness for containerized cargo while maintaining its utility for bulk commodities.
Railway tunnels built in the 1880s limit double-stack container clearance on several key routes. The East River Tunnels in New York, completed in 1910, cannot accommodate modern double-stack railcars without extensive—and extremely costly—modifications. This constraint diverts container traffic to alternative routes, increasing truck miles and congestion.
Port Hierarchy Persistence
The historical water-rail network created permanent port hierarchies. New Orleans, established in 1718 at the Mississippi River’s mouth, remains the sixth-largest port in the United States by tonnage. Montreal, founded at the head of ocean navigation on the St. Lawrence, handles over 35 million metric tons annually. Baltimore, located at the fall line where the Piedmont meets the Coastal Plain, remains the busiest U.S. port for roll-on/roll-off cargo.
These locations were not optimized for modern shipping; they were optimized for 18th- and 19th-century shipping technologies. Yet the infrastructure investment required to relocate them—dredged channels, rail connections, highway access, warehousing—makes relocation economically infeasible. The ports persist because the cost of moving them exceeds the efficiency gains of better locations.
---
4. Market Predictions: The Next Two Decades
Commodity Flows Will Remain Water-Dependent
The physics of bulk commodity transport dictate that water routes will continue handling heavy, low-value-per-ton cargoes (iron ore, coal, grain, aggregates, petroleum products). The U.S. Army Corps of Engineers projects that inland waterway tonnage will grow at 0.5-1.0% annually through 2040, constrained by lock capacity and dredging budgets (Source: USACE Navigation Forecast). The Mississippi River system, handling over 500 million tons annually, will remain the continent’s primary bulk commodity corridor.
Rail Intermodal Growth Will Favor Legacy Corridors
The shift toward intermodal containerization benefits railways with established double-stack clearance and terminal capacity. The Union Pacific’s Overland Route (Omaha to Sacramento), following the original Central Pacific alignment, will see continued capacity investment. The Canadian National’s transcontinental route (Halifax to Vancouver), built along the Grand Trunk Pacific alignment, will handle increased Asian-Pacific trade redirected through Canadian ports as Prince Rupert expands.
Modal Shift Constraints
Shifting significant freight from rail or barge to truck is unlikely due to driver shortages, fuel costs, and highway congestion. The American Transportation Research Institute reports truck driver turnover rates exceeding 90% for large carriers, limiting capacity expansion. Legacy water-rail corridors will absorb growth through incremental capacity improvements rather than mode-share changes.
Infrastructure Investment Tensions
The U.S. inland waterway system faces an estimated $5-10 billion in deferred lock and dam maintenance. Railway capacity investments run approximately $25-30 billion annually across North America. These capital needs will compete with highway and digital infrastructure for public funding. The three-year delay in Panama Canal expansion (2007-2016) demonstrates that large-scale water infrastructure projects face cost overruns and schedule slippage that reduce potential competitive advantages against rail.
Climate Resilience Considerations
Legacy water routes face climate-related risks: lower Mississippi River water levels (2022-2023 drought reduced barge capacity by 38%), Great Lakes low-water periods, and increased lock maintenance due to temperature extremes. Railways face heat-related track buckling and cold-weather equipment failures. These risks will increase maintenance costs but are unlikely to alter corridor economics, as alternative routes face similar climate exposure.
---
Conclusion: The Permanent Geography of Freight
North America’s freight corridors are not abstract lines on a map but physical manifestations of decisions made in the 19th century. The engineers who cut the Erie Canal through upstate New York, the surveyors who chose the Donner Pass route for the Central Pacific, and the politicians who granted land to railroads created the continent’s transport infrastructure at a cost that modern economies cannot replicate. The St. Lawrence Seaway, the Mississippi River system, the transcontinental railways, and the Intracoastal Waterway persist not because they are optimal for 21st-century logistics but because the capital invested in them—and the economic geography built around them—cannot be abandoned or moved at any feasible cost.
The next generation of logistics operators will optimize routing, consolidate loads, and adopt automation technologies. But they will do so within corridors laid out by water levelers and railroad surveyors working with levels, transits, and horse-drawn scrapers. The hidden grid remains the grid.
Trade Metrics
Related Datasets
Q4 Cross-Border Logistics Report
PDF • 4.2 MB
Automotive Parts Supply Chain Index
CSV • 1.1 MB