Beyond the 19% Surge: How the Port of Los Angeles is Rewiring Global Supply

Lisa Park
Supply Chain Editor
April 18, 2026
DATELINE: NA TRADE WIRE
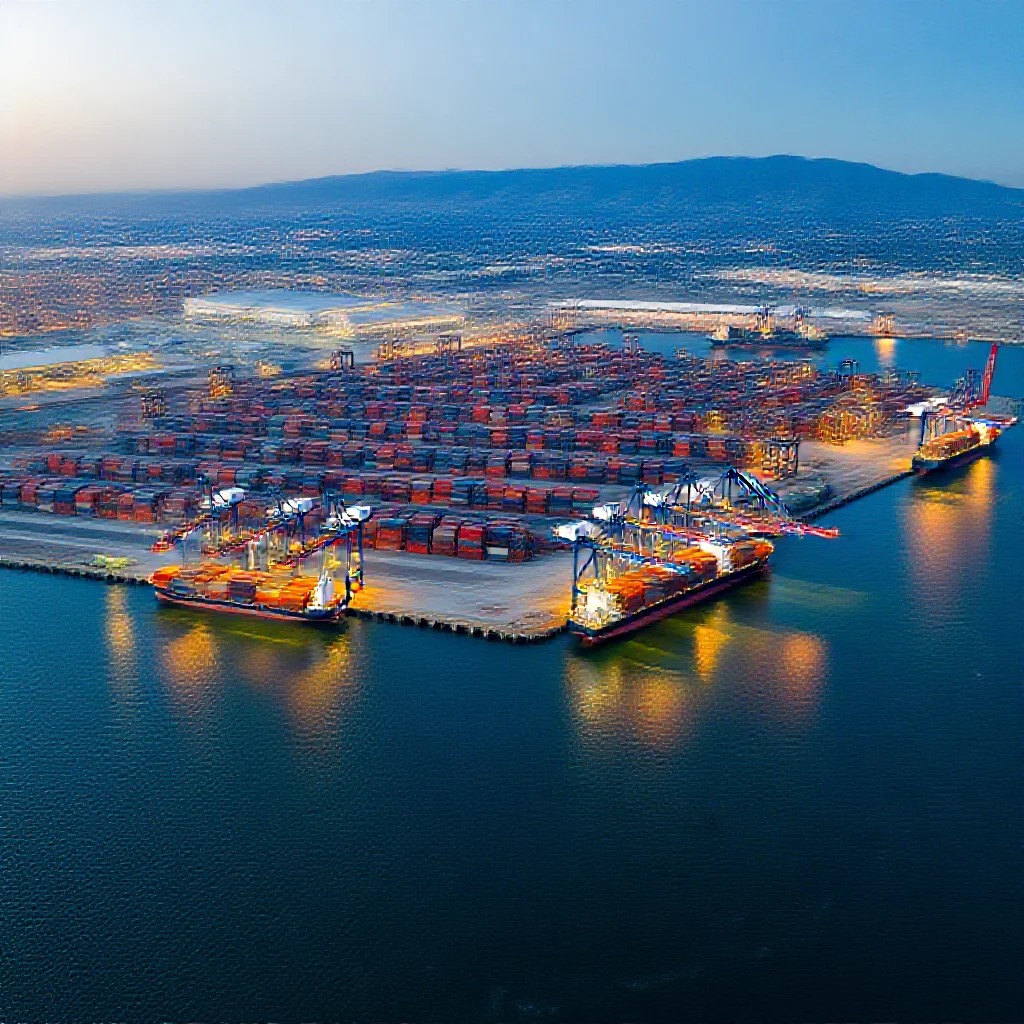
"The Port of Los Angeles's March 2024 cargo data reveals a 19% year-over-year"
Beyond the 19% Surge: How the Port of Los Angeles is Rewiring Global Supply Chains for a Volatile Era
The Port of Los Angeles reported a 19% year-over-year increase in cargo volume for March 2024, moving 743,417 Twenty-Foot Equivalent Units (TEUs) (Source 1: [Primary Data]). For the first quarter, the increase was more pronounced, with a 30% rise to 2,380,503 TEUs compared to the same period in 2023 (Source 1: [Primary Data]). A breakdown of the March figures reveals a cargo mix characteristic of current trade dynamics: loaded imports reached 382,040 TEUs, loaded exports totaled 120,075 TEUs, and empty containers accounted for 241,302 TEUs (Source 1: [Primary Data]). While the port attributed the strong performance to retailers stocking for spring and summer, the underlying data and strategic context suggest a more fundamental recalibration is underway.
The Headline Numbers: Decoding the March 2024 Surge
The 743,417 TEU volume for March 2024 represents a significant rebound from the softer performance observed in 2023. The 30% first-quarter surge further underscores a shift in momentum. The composition of the throughput is analytically critical. The substantial gap between loaded imports (382,040 TEUs) and loaded exports (120,075 TEUs) continues a long-standing trade imbalance. However, the high volume of empty containers (241,302 TEUs) is a direct logistical consequence; these boxes are being repositioned to Asian manufacturing hubs to fulfill ongoing import demand. This activity, while not adding direct economic value, is a necessary cost and operational signal of sustained import volume expectations. The numerical increase, therefore, is not an isolated event but a quantitative indicator of renewed goods movement through this specific gateway.
Not Just Seasonal Stocking: The 'Permacrisis' Supply Chain Mindset
Attributing the volume increase solely to seasonal inventory building provides an incomplete narrative. The port’s own statement acknowledges it is managing impacts from global trade tensions and energy market volatility (Source 1: [Primary Data]). This points to a deeper, strategic shift in supply chain philosophy. In an environment of persistent geopolitical friction and unpredictable energy costs, the primary objective for shippers is transitioning from pure cost optimization to assured reliability. Major, well-equipped gateways like the Port of Los Angeles offer a perceived lower risk of severe disruption compared to alternative, potentially cheaper routes that may be more exposed to chokepoint volatility or political instability. The increased volume reflects a tactical inventory rebuild, but one conducted with a "permacrisis" mindset—where buffer stock and dependable routing are prioritized to mitigate systemic uncertainty. The cargo surge is, in effect, a market vote for resilience over marginal efficiency.
The Dual-Track Reinvention: Infrastructure Meets Digital Nervous System
The port’s response to this volatile environment is a dual-track strategy of physical and digital transformation. On the infrastructure front, investments in terminal upgrades and on-dock rail expansion are designed to increase cargo velocity and reduce dependency on over-the-road trucking. Concurrently, the strategic deployment of zero-emission cargo handling equipment serves a dual purpose: it addresses regulatory and sustainability targets while also functioning as a long-term operational hedge against fossil fuel price volatility and future carbon-related costs.
Complementing these physical investments is the development of a digital "Control Tower" tool (Source 1: [Primary Data]). This system aims to aggregate and analyze data across the logistics chain, transforming the port from a point of potential congestion into a hub of predictability. By providing enhanced visibility into cargo status, estimated arrival times, and terminal capacity, the technology seeks to reduce costly delays and idle time for vessels, trucks, and railroads. The combined effect of hardened infrastructure and a digital nervous system is intended to lower systemic friction at America’s busiest container port.
The Long-Term Imprint: LA's Bid to Become the Supply Chain's Shock Absorber
The convergence of increased throughput, strategic shipper behavior, and capital investment is redefining the Port of Los Angeles’s role in global logistics. The objective is no longer merely to process a higher volume of containers. The integrated strategy aims to build a more resilient, predictable, and operationally sustainable node within the supply chain. By reducing friction through physical efficiency and digital transparency, the port seeks to evolve from a passive gateway into an active shock absorber for the U.S. economy. This role mitigates the propagation of external disruptions—be they geopolitical, climatic, or pandemic-related—into domestic markets.
The long-term imprint of this strategy will be measured by key performance indicators beyond TEU volume: consistent reductions in vessel dwell time, increased rail throughput, growth in the use of zero-emission equipment, and the measurable reliability gains reported by supply chain partners utilizing the digital platform. If successful, the port’s model will reinforce its status as a premier gateway by offering not just scale, but stability—a critical competitive advantage in an era defined by volatility. The March 2024 numbers are a snapshot of demand; the underlying investments are a blueprint for managing that demand amidst continuous global uncertainty.
Trade Metrics
Related Datasets
Q4 Cross-Border Logistics Report
PDF • 4.2 MB
Automotive Parts Supply Chain Index
CSV • 1.1 MB