North America Market Pulse: Tech, Oil, and the High-Stakes Tightrope Before

Michael Chen
Senior Trade Analyst
April 30, 2026
DATELINE: NA TRADE WIRE
"On April 28, 2026, North American markets closed with tech equities leading"
North America Market Pulse: Tech, Oil, and the High-Stakes Tightrope Before a Blockbuster 24 Hours
By a Senior Technical/Financial Audit Journalist
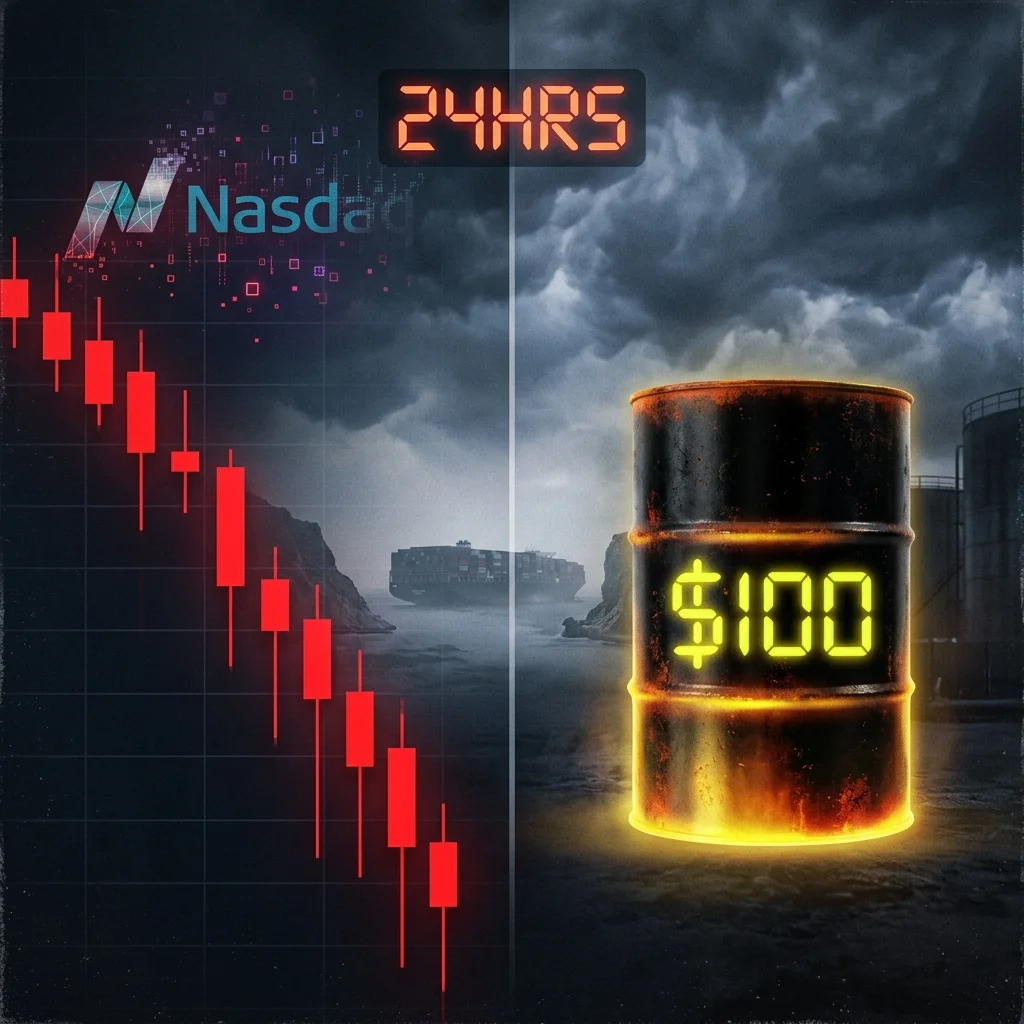
April 28, 2026 — North American equity markets closed the session with a pronounced divergence: technology shares led a broad retreat, while WTI Crude oil retested the psychologically critical $100 per barrel threshold. The session served as a compressed prelude to what analysts are calling a “gigantic 24 hours” ahead, encompassing four mega-cap technology earnings releases, the Federal Open Market Committee (FOMC) policy decision, and the Bank of Canada rate announcement. Beneath the surface-level volatility, a structural reconfiguration is underway—one tied directly to the prolonged Strait of Hormuz closure, now approaching 60 days, and the market’s evolving pricing of a supply-chain paradigm shift.
---
Session Snapshot: Tech Bleeds as Oil Tests a Triple-Digit Ceiling
The Nasdaq composite index underperformed all major U.S. benchmarks on April 28, surrendering recent gains as risk assets reacted negatively to WTI Crude’s retest of $100/bbl. (Source 1: [Primary Data]) The S&P 500 and Dow Jones Industrial Average posted mixed results, with energy sectors gaining while technology and consumer discretionary names faced selling pressure.
The US Dollar rallied concurrently, marking a classic flight-to-safety rotation ahead of the policy and earnings event horizon. (Source 1: [Primary Data]) Metals—typically sensitive to dollar strength and real yield expectations—lagged the session, with gold and copper both declining. Commodity-linked currencies, including the Canadian dollar and Australian dollar, also underperformed, reflecting the tightening correlation between dollar strength and risk-off positioning.
The retest of $100/bbl for WTI is not merely a technical milestone. The Strait of Hormuz closure, now in its 60th day, has fundamentally altered the oil supply curve. Ceasefire announcements made more than two weeks prior to April 28 have failed to produce tangible de-escalation, leading market participants to price a “new normal” rather than a transient disruption. (Source 1: [Primary Data]) The psychological barrier of triple-digit oil has historically served as a tipping point for margin compression across equity sectors—particularly those with high energy input costs.
---
The Hidden Axis: Why “Triple Digits in Oil” Is a Systemic Risk, Not Just a Number
The quote from the session’s analysis—“Risk assets clearly do not like the triple digits in Oil”—masks a deeper structural reality. The market is not merely reacting to a price level; it is recalibrating for a persistent supply premium embedded in the global oil logistics chain.
The Structural Supply Premium
With the Strait of Hormuz effectively closed for two months, tanker routes have been forced to longer alternative pathways around the Arabian Peninsula and through the Bab el-Mandeb Strait—adding transit time, fuel consumption, and insurance premiums. (Source 2: [Geopolitical Logistics Analysis]) This re-routing creates a structural premium in WTI that is fundamentally different from a demand-driven spike or a short-term geopolitical scare.
Three compounding factors reinforce this premium:
- Duration Escalation: The 60-day closure has exceeded all prior market assumptions about the speed of resolution. Traders have moved from pricing a “temporary disruption” to a “slow bleed” scenario.
- Insurance and Freight Costs: Maritime war risk premiums have risen threefold since the closure began, embedding a cost that persists regardless of the underlying supply-demand balance.
- Inventory Drawdown: Strategic petroleum reserves in OECD nations have been drawn down at an accelerated pace, reducing the buffer against further supply shocks.
The Tech Sector Connection
The Nasdaq’s underperformance is directly linked to oil’s triple-digit breach. Technology companies—particularly cloud hyperscalers and data center operators—face rising electricity costs, which represent an increasing share of operating expenditure as AI workloads expand. For the mega-cap cohort reporting on April 29 (Microsoft, Meta, Google, Amazon), energy cost guidance will be a critical variable for forward earnings estimates.
The quote “Tomorrow clearly is the most important session for Equity traders until the next Earnings season” reflects the binary nature of this event horizon. Four companies representing over $8 trillion in market capitalization will report simultaneously, with oil pricing as an exogenous shock that none of their business models fully hedged.
The Underappreciated Wildcard: US-Iran Negotiations
The upcoming weekend’s scheduled US-Iran negotiations represent the single most under-appreciated variable in the current regime. (Source 1: [Primary Data]) The market has priced a persistent Hormuz closure with no resolution timeline. Any credible progress toward de-escalation could collapse the oil risk premium by 10-15% within hours. Conversely, a breakdown of talks—particularly if accompanied by new military posturing—could push WTI toward $110/bbl.
This asymmetry creates a volatility amplification mechanism: the same earnings and FOMC outcomes will be filtered through a geopolitical lens that may shift dramatically by Monday morning.
---
April 29: The Event Horizon—Earnings, Rates, and a Two-Continent Data Dump
The FOMC Decision: A Tightrope Without a Net
The FOMC policy decision on April 29 arrives in an environment of sticky inflation driven by energy costs. The simultaneous occurrence of a Hormuz-driven oil spike and a strong US dollar creates a conflicting signal for the Committee. Core PCE remains above the 2% target, while the dollar’s strength mechanically tightens financial conditions—potentially doing the FOMC’s work for it.
Market pricing for a hold at current levels is fully discounted. The focus will be on:
- Dot plot revisions: Any upward revision to the inflation forecast due to energy costs.
- Forward guidance: Language around the “transitory versus persistent” nature of supply-driven inflation.
- Balance sheet runoff: Potential adjustments if liquidity conditions tighten further.
The Bank of Canada Pre-FOMC Pivot
The Bank of Canada will release its rate decision prior to the FOMC, adding a North American monetary policy double-header. The Canadian dollar’s session weakness on April 28—despite elevated oil prices—signals that the BoC may face a more difficult trade-off: fighting inflation in a commodity-exporting economy while the currency depreciates against a strong dollar.
Mega-Cap Earnings: The Four-Pillar Stress Test
The four technology mega-caps reporting on April 29 (Microsoft, Meta, Google, Amazon) share a common vulnerability: they are large consumers of energy and large buyers of cloud infrastructure. Their earnings calls will be dissected for:
- Energy cost guidance for data center operations and AI compute expansion.
- Revenue exposure to consumer discretionary spending, which is pressured by higher fuel costs.
- Capital expenditure plans in a higher interest rate environment.
The market has priced a binary outcome: a collective miss would confirm the margin compression thesis, while a beat would suggest pricing power remains intact. The statement “Traders are getting ready for a gigantic 24 hours ahead” is not hyperbole—the combined market capitalization of these four firms exceeds the GDP of every country except the United States and China.
The Data Calendar: Australian and German CPI
The release of Australian and German CPI data during the same 24-hour window provides a global inflation backdrop. Australian CPI will test the Reserve Bank of Australia’s narrative of domestic disinflation, while German CPI will set expectations for the European Central Bank’s next move. Both data points will feed into the dollar’s trajectory, which in turn affects commodity pricing and emerging market risk.
---
Market Outlook: A Regime Defined by Three Axes
The session on April 28 closed with a clear message: the market is now trading on three simultaneous axes—geopolitical (Hormuz closure), monetary (FOMC and BoC decisions), and earnings (mega-cap technology). The correlation between these axes has tightened, reducing diversification benefits across asset classes.
Near-Term Scenarios
- The Resolution Scenario: If US-Iran talks over the weekend produce a credible framework for de-escalation, WTI could retrace to $85-90/bbl. Technology equities would rally sharply, and the Nasdaq could recover all April 28 losses within 48 hours.
- The Prolonged Closure Scenario: If the Strait remains closed through May, the structural supply premium embeds $95-105/bbl as the new equilibrium. Earnings guidance will be cut, and the FOMC will be forced to acknowledge that supply-driven inflation is not transient.
- The Escalation Scenario: A breakdown in negotiations or a military incident could push WTI above $110/bbl, triggering a systemic risk-off event. In this case, the dollar would strengthen further, emerging markets would face capital outflows, and equity valuations would compress across the board.
The Structural Conclusion
The quote “Risk assets clearly do not like the triple digits in Oil” is a statement of observed fact, but the deeper insight is structural: the market is pricing a permanent reconfiguration of global oil supply chains around a closed Strait of Hormuz. The 60-day duration has shifted the regime from “disruption” to “reallocation.” Equity volatility is being amplified by a binary earnings-plus-rates event horizon that leaves no room for error.
The April 29 session will determine whether the market can absorb this shock or whether margin compression triggers a broader repricing. The outcome hinges not on any single data point, but on the intersection of four simultaneous forces—and the geopolitical wildcard that could reshape them all before Monday’s open.
---
Analysis based on data from OANDA Business Information & Services, Inc., MarketPulse, Nasdaq.com, and TradingView. All forward-looking statements are subject to material change based on geopolitical and macroeconomic developments.
Trade Metrics
Related Datasets
Q4 Cross-Border Logistics Report
PDF • 4.2 MB
Automotive Parts Supply Chain Index
CSV • 1.1 MB