Beyond the Ceasefire: How a Fragile Peace and a Hawkish Fed Are Reshaping

Michael Chen
Senior Trade Analyst
April 28, 2026
DATELINE: NA TRADE WIRE
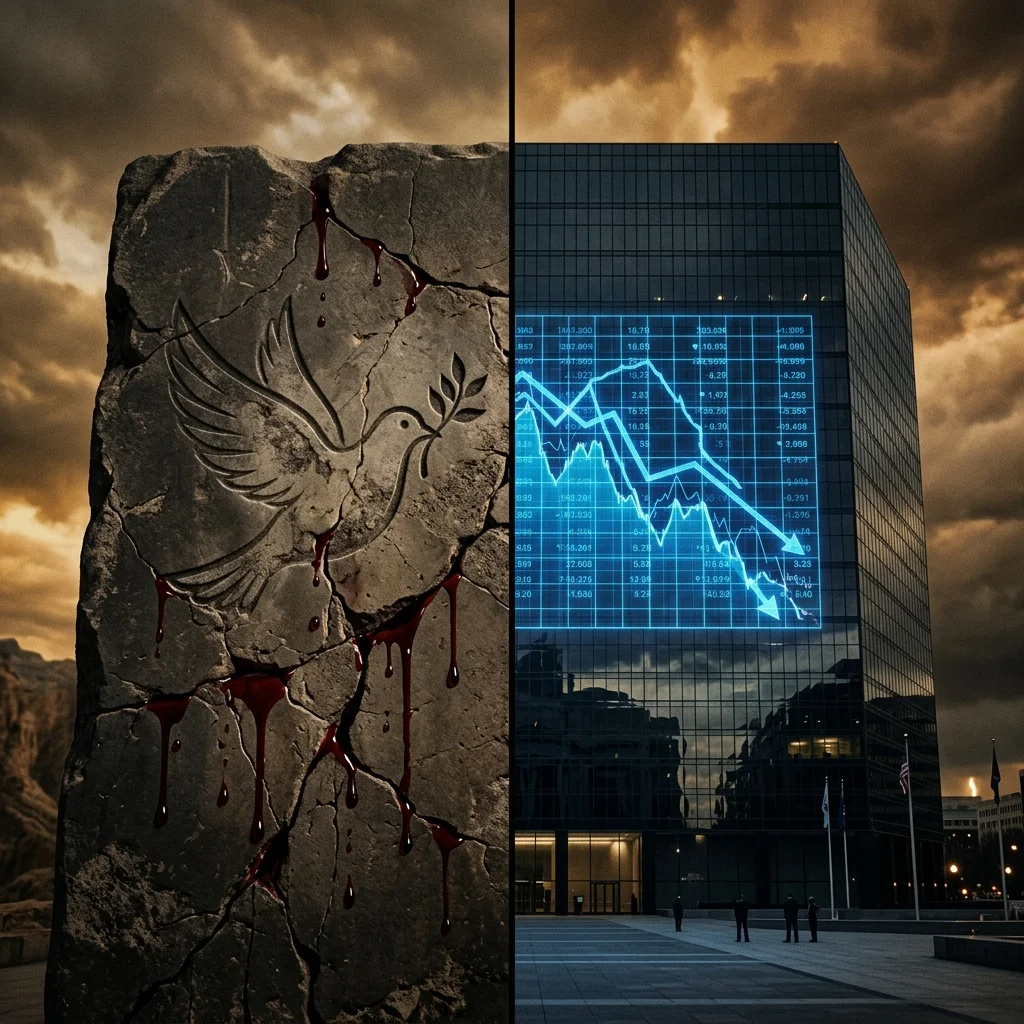
"This analysis goes beyond the headline of the temporary ceasefire extension"
Beyond the Ceasefire: How a Fragile Peace and a Hawkish Fed Are Reshaping North American Markets
April 22, 2026 | 14:40 UTC
---
Executive Summary
North American equity markets have extended their rally to record levels, with the Nasdaq advancing 6.50% over ten sessions and the S&P 500 gaining 4.55% in the past week (Source 1: MarketPulse, Intraday Data). This upward trajectory follows a four-hour extension of the Middle East ceasefire announced on April 21, 2026. However, beneath the surface of these nominal records, three structural discontinuities are emerging: an escalating Iran-Hormuz supply chain threat not reflected in equity risk premiums, a fundamental regime change at the Federal Reserve under Chairman Kevin Warsh, and a divergence between Canadian inflation dynamics and U.S. consumption strength that is creating an asymmetric risk profile for the USD/CAD corridor. This analysis dissects the gap between market sentiment and underlying fragility, arguing that the current "risk-on" positioning is a liquidity-driven phenomenon disconnected from deteriorating fundamentals.
---
1. The Fragile Rally: Why Record Highs Mask Structural Risk
The Numbers
The S&P 500 has appreciated approximately 50% since the one-year anniversary of Liberation Day (Source 1: MarketPulse, Historical Benchmark Comparison). Three consecutive sessions last week produced all-time highs. The Nasdaq's ten-day surge represents a velocity of gains typically associated with capitulation squeezes rather than organic accumulation.
The Divergence
The ceasefire extension—announced approximately four hours before the deadline on April 21—is not a resolution. Iran has stated it will "send a delegation only if it serves Iran's best interests" (Source 2: Official Statement, April 22, 2026). Concurrently, Iran has attacked a third tanker in the Strait of Hormuz on April 22, 2026. This is not a cessation of hostilities; it is a recalibration of pressure points.
The equity market is pricing a "peace dividend" that assumes normalization of energy supply chains. Data contradicts this assumption. WTI Crude fell below $85 per barrel last Friday, then rebounded to approximately $90 per barrel (Source 1: MarketPulse, Commodity Futures Data). This oscillation is consistent with a market hedging against an imminent supply shock, not one discounting stability. The CBOE Crude Oil Volatility Index (OVX) has diverged sharply from the S&P 500's trajectory over the past week—a classic precursor to correlation breakdown in risk assets.
Analytical Conclusion
This rally is liquidity-driven, not fundamentals-driven. The Federal Reserve has maintained accommodative positioning through the ceasefire negotiations, but the underlying supply chain deterioration—specifically the third Hormuz tanker attack—represents a tail risk that equity volatility indices (VIX) have not yet repriced. The market is exhibiting "volatility complacency" at a moment when commodity volatility is rising. For institutional investors, this divergence creates a mechanical vulnerability: any forced deleveraging from commodity margin calls could cascade into equity liquidation, given the high correlation between energy and equity exposures in current multi-asset portfolios.
---
2. The Warsh Doctrine: The End of the "Fed Put"
The Structural Shift
Chairman Kevin Warsh's recent Senate hearing signaled three concrete policy departures: the elimination of forward guidance as a communication tool, aggressive reduction of the Federal Reserve's balance sheet, and the establishment of a new inflation framework (Source 3: Senate Testimony Record, April 2026). This is not a marginal adjustment; it is a structural regime change.
Deconstructing the Doctrine
Forward guidance has been the primary mechanism through which the Fed has provided certainty to markets since the 2008 financial crisis. Removing it increases information asymmetry between the central bank and market participants. The consequence is not greater freedom for the Fed—it is greater uncertainty for asset prices. When market participants cannot calibrate the probability of future rate paths, term premiums expand, and liquidity in rate-sensitive instruments contracts.
The balance sheet reduction component is more consequential. The "Fed Put"—the implicit guarantee that the central bank would intervene to stabilize asset prices during downturns—propped up equity valuations for over a decade. A hawkish structural shift combined with a fragile ceasefire creates what this analysis terms a "stop-go" risk environment: the Fed is tightening liquidity (the "stop") while the geopolitical "go" signal from the ceasefire is weak and unverified.
Liquidity Drain Metrics
Quantitative tightening at an accelerated pace, combined with the Treasury General Account rebuilding, is draining reserve balances at a rate of approximately $80-100 billion per month. This is occurring simultaneously with the maturing of the Bank Term Funding Program facilities. The net liquidity withdrawal from the financial system is the most aggressive since the 2018-2019 QT episode. The difference is that in 2018, the geopolitical environment was stable. Today, a liquidity drain coincides with a supply chain crisis.
Long-Term Implications
For long-duration investors, the Warsh doctrine implies a permanent reduction in the discount rate advantage that has supported elevated equity multiples. The new inflation framework is likely to target a lower tolerance for overshoots, meaning the Fed will act preemptively against inflation before it materializes—a policy approach that systematically reduces the asymmetric upside for risk assets. The "TINA" (There Is No Alternative) thesis to equities is being structurally dismantled.
---
3. CAD vs. USD: The Divergence Playbook
The Data
Canadian CPI registered 2.4% year-over-year, with a 0.9% month-over-month increase (Source 4: Statistics Canada, April 2026). The Bank of Canada left rates unchanged. In contrast, U.S. Retail Sales surged 1.7% month-over-month (Source 5: U.S. Census Bureau, April 2026). The Dollar Index (DXY) is consolidating above the 98.00 level.
The CAD Paradox
The Canadian Dollar is bouncing against most FX peers, yet USD/CAD is stalling at the 1.3630-1.3660 support zone within a defined bear channel (Source 1: MarketPulse, FX Technical Analysis). This is not a signal of CAD strength. It is a capitulation zone where short-term momentum traders have exhausted selling pressure, but structural sellers remain absent.
Sticky-Flation Dynamics
The Canadian economy is exhibiting what can be termed "sticky-flation": CPI remains above the Bank of Canada's target range while economic growth indicators are softening. The 0.9% monthly CPI increase is the highest print in the G7 for this reporting period (Source 6: Cross-Country Inflation Comparison, BLS/Statistics Canada). The Bank of Canada's rate hold, despite this inflation persistence, indicates a willingness to tolerate higher prices in exchange for labor market stability.
The Divergence Trade
The U.S. retail sales surge (1.7% m/m) versus Canadian CPI persistence (0.9% m/m) creates a policy divergence: the Fed under Warsh is tightening into strength, while the Bank of Canada is holding into inflation. This asymmetry favors USD strength, not CAD strength.
The 98.00 level on DXY is a critical pivot point. A breakdown below 98.00 would require a synchronized global dovish pivot that is not occurring. Conversely, a hold above 98.00, combined with the Warsh hawkish tilt, suggests DXY will target 100.00 in the medium term. For USD/CAD, the 1.3630-1.3660 support zone is likely to break south only if the Bank of Canada is forced to hike—a scenario contradicted by their current rate hold. The more probable path is a reversal toward the 1.3850-1.3900 resistance zone over the next two weeks.
---
4. Forward Risk Scenarios
Scenario A: Ceasefire Breakdown (Probability: 35%)
If the third Hormuz tanker attack escalates into a blockade or retaliatory strikes, WTI Crude would spike above $95-100. The equity rally would reverse in a "risk-off" deleveraging event. The Fed under Warsh would be unlikely to intervene, as the inflation impulse from higher energy prices would validate the hawkish framework. USD/CAD would test 1.3900 as CAD weakens on imported inflation risk.
Scenario B: Fragile Stability (Probability: 45%)
The ceasefire holds nominally but further tanker attacks occur intermittently. Energy volatility remains elevated. The Fed continues balance sheet reduction. Equities trade in a tight range, grinding lower as liquidity drains. USD/CAD oscillates between 1.3630 and 1.3800. This is the "muddle-through" scenario with asymmetric downside risk.
Scenario C: Diplomatic Breakthrough (Probability: 20%)
Iran negotiates in good faith. Hormuz reopens fully. Oil drops to $80. The Fed pauses balance sheet reduction. Equities rally further. USD/CAD breaks below 1.3600. This is the lowest-probability scenario based on Iran's stated position of conditional participation.
---
Conclusion
The North American market pulse on April 22, 2026, is best characterized as febrile: elevated temperature with weak diagnostic markers. The equity rally to all-time highs is a liquidity event built on the assumption of a peace that has not materialized. The Federal Reserve under Kevin Warsh is structurally withdrawing the support mechanisms that have historically backstopped drawdowns. The Canadian Dollar's recent bounce against peers is a tactical adjustment, not a strategic reversal.
For institutional readers, the key risk is correlation breakdown: the assumption that equities, credit, and currencies move in predictable patterns during risk-on and risk-off regimes is being invalidated by the coexistence of a hawkish Fed and a fragile ceasefire. The most prudent positioning is a reduction in equity beta, an overweight to USD cash, and short-duration fixed-income instruments. The "buy the dip" reflex that has defined post-2008 market behavior may be entering its terminal phase.
---
Disclaimer: This analysis is for informational purposes only and does not constitute investment advice. Market conditions are subject to rapid change. Readers should conduct their own due diligence before making investment decisions.
Trade Metrics
Related Datasets
Q4 Cross-Border Logistics Report
PDF • 4.2 MB
Automotive Parts Supply Chain Index
CSV • 1.1 MB