Mastering Industry Analysis: A Comprehensive Guide to Newman Library''s Research

James Wilson
Industry Analyst
June 9, 2026
DATELINE: NA TRADE WIRE
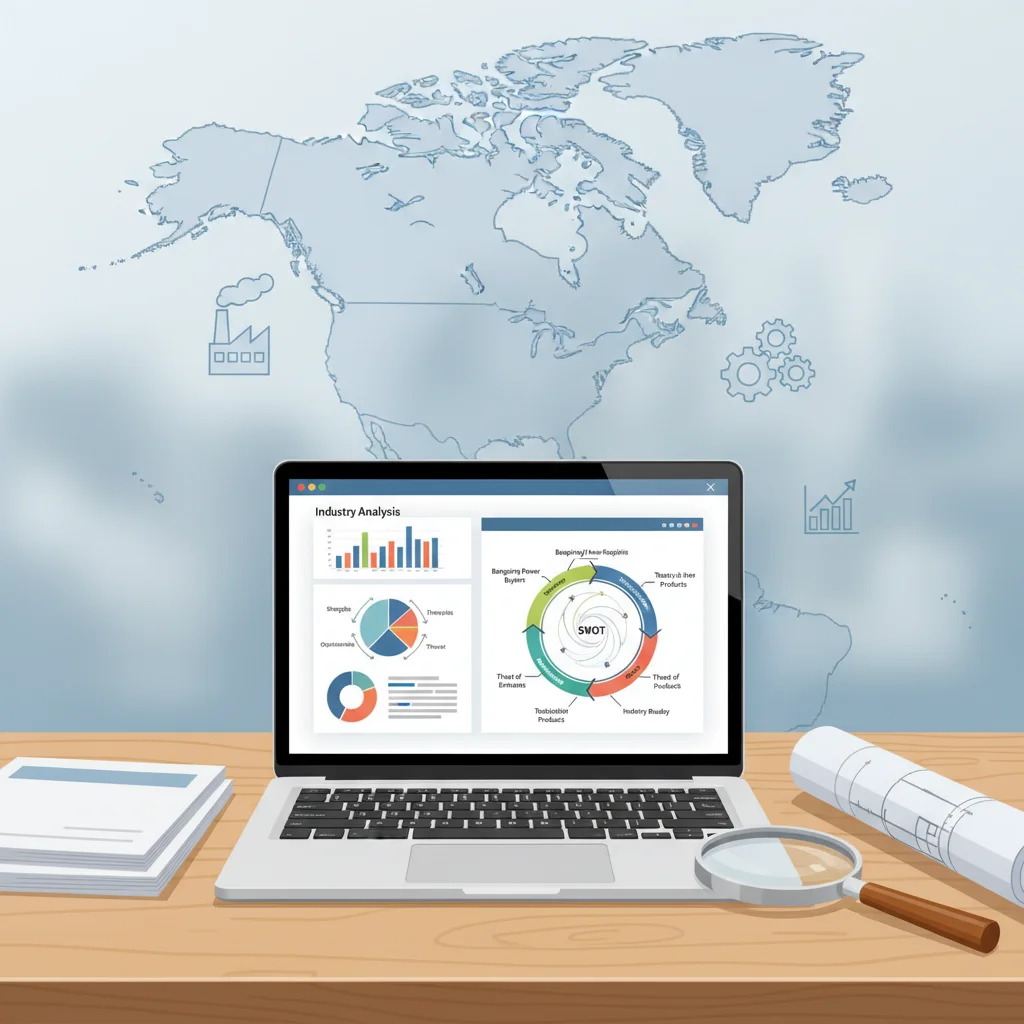
"This article provides an in-depth walkthrough of the resources available"
Mastering Industry Analysis: A Comprehensive Guide to Newman Library's Research Resources for North American Markets
Introduction: The Strategic Value of Industry Analysis in North America
Industry analysis is the cornerstone of sound investment decisions, competitive strategy, and market entry planning. In North America—a mature yet rapidly evolving market shaped by technological disruption, regulatory shifts, and shifting consumer behavior—accurate and timely industry research can mean the difference between a winning strategy and a costly misstep. Whether you are a graduate student preparing a case study, a faculty member developing curriculum, or a professional conducting due diligence for a new venture, the ability to systematically evaluate an industry’s competitive landscape is an indispensable skill.
Newman Library at Baruch College stands as a critical hub for this kind of research. As part of the City University of New York system, the library offers both digital and physical resources that bridge academic rigor with real-world application. Its extensive collection of databases, classification tools, and analytical frameworks supports users in performing thorough, data-driven industry analysis. This guide provides a practical walkthrough of the most essential resources available through Newman Library, with a sharp focus on North American markets. From decoding industry classification codes to leveraging powerful databases like Bloomberg Professional and IBISWorld, readers will gain a clear workflow for conducting professional-grade industry audits.
[IMAGE: Photo of Newman Library reading area or the Subotnick Financial Services Center entrance]
Decoding Industry Classification: NAICS, SIC, and GICS
Before diving into databases, researchers must understand the language of industry classification. North America uses a trio of coding systems, each tailored to a specific research context. The North American Industry Classification System (NAICS) is the standard for the United States, Canada, and Mexico, making it indispensable for any North America industry research. Developed to replace the older Standard Industrial Classification (SIC) system, NAICS uses a six-digit code structure that allows for greater granularity—especially in emerging sectors like information technology and healthcare.
The SIC system, though largely superseded, remains embedded in legacy databases and historical financial data. Many company filings and older industry reports still refer to four-digit SIC codes. Meanwhile, the Global Industry Classification Standard (GICS), developed jointly by S&P and MSCI, is the preferred system among financial professionals. GICS uses an eight-digit hierarchical structure—sector, industry group, industry, and sub-industry—and is the backbone of portfolio management and equity research.
The challenge for researchers is that different databases often use different classification schemes. For example, IBISWorld primarily relies on NAICS, while S&P NetAdvantage uses GICS for its industry reports, and Business Source Complete may index articles by both NAICS and SIC. Cross-referencing these codes is therefore a critical skill. Newman Library provides a dedicated research guide with lookup tools that map between NAICS, SIC, and GICS, allowing users to search consistently across platforms. A typical workflow: start with a NAICS code for a broad industry, then map it to the corresponding GICS sector for financial analysis, and finally use the SIC code to locate legacy reports.
[IMAGE: Side-by-side diagram comparing NAICS (6-digit), SIC (4-digit), and GICS (8-digit) hierarchy levels]
Core Databases: Industry Profiles, Financial Data, and Marketing Insights
Newman Library offers a powerful suite of databases that together cover nearly every aspect of industry analysis. Each database has unique strengths, and understanding when to use which is key to efficient research.
Bloomberg Professional (Subotnick Financial Services Center)
The Bloomberg terminal is the gold standard for real-time financial data and competitor analysis. Available at the Subotnick Financial Services Center, it provides a wealth of industry-level information. To access industry overviews, users can type the function BI (Bloomberg Industry). This command pulls up a dashboard showing top companies in a sector, their market capitalizations, key ratios, and recent news. For deeper competitive analysis, the RV (Relative Valuation) function compares a company’s valuation metrics against its industry peers. Bloomberg is particularly strong for monitoring North American markets in real time—tracking earnings calls, mergers, and macroeconomic indicators that influence industry dynamics.
S&P NetAdvantage
Published by Standard & Poor’s, S&P NetAdvantage offers comprehensive industry profiles for approximately 50 major industries. Each report follows a consistent structure: an overview, current issues and trends, key operating segments, and a detailed list of the top companies in the industry. Notably, many reports include a dedicated Porter’s Five Forces analysis, providing a ready-made framework for evaluating competitive intensity. For example, a report on the U.S. aerospace and defense industry will assess the bargaining power of suppliers (e.g., specialized component manufacturers) and the threat of new entrants (e.g., emerging drone startups). Researchers can also use the “Industry Surveys” section to compare profitability, growth rates, and capital structures across sectors. This database is ideal for quickly building a baseline understanding of an industry’s structure.
IBISWorld
With over 700 U.S. industry profiles and a growing collection of global reports, IBISWorld is a go-to resource for deep competitive audits. Every IBISWorld report features a Porter’s Five Forces analysis as a standard component, along with a SWOT analysis in many cases. The reports are exceptionally detailed, covering market size, industry life cycle, product segmentation, and key external drivers. For instance, a researcher analyzing the craft brewing industry can access data on number of breweries, average revenue per establishment, and the impact of changing consumer preferences. IBISWorld also provides industry risk ratings and a five-year outlook, making it valuable for forecasting. Because the database is NAICS-based, it aligns seamlessly with the classification research step described earlier.
Fitch Solutions BMI
Fitch Solutions BMI (Business Monitor International) covers 20+ industry sectors across more than 200 global markets, with particularly robust coverage of North America. Each report includes detailed forecasting models and, critically, a full SWOT analysis (Strengths, Weaknesses, Opportunities, Threats). This framework complements Porter’s Five Forces by incorporating external macro-environmental factors such as regulatory policy, technology adoption, and demographic shifts. For example, a Fitch report on the Canadian mining industry would include a SWOT matrix alongside macroeconomic projections for commodity prices and trade policy. The database also offers customizable data visualization tools, allowing users to export charts and tables for presentations.
Passport (Euromonitor)
Restricted to Baruch College and CUNY SPS users, Passport by Euromonitor International covers more than 200 countries with extensive statistics, strategic analysis, and consumer trend reports. While its orientation is consumer-facing industries (e.g., food and beverages, apparel, retail, travel), the depth of its data is unmatched. Passport provides market sizes, brand shares, distribution channel data, and lifestyle indicators. For North America research, its detailed consumer survey data can reveal shifts in purchasing behavior that affect entire industries—such as the rise of e-commerce in the U.S. grocery sector or the impact of sustainability concerns on the automotive market. The “Industry Analysis” section often includes both SWOT and PESTLE frameworks.
Gale Business: Insights
For researchers seeking a broader perspective that integrates company and industry data, Gale Business: Insights is a versatile tool. Selecting “Industries” via the advanced search feature allows users to retrieve industry essays, market share reports, and financial ratios. The platform also provides access to full-text articles from business journals and trade publications, which can supplement the structured data from other databases with qualitative insights. While not as specialized as IBISWorld or Bloomberg, it is an excellent starting point for preliminary research and for understanding how industries are covered in the business press.
[IMAGE: Screenshot mockup showing four database search interfaces: IBISWorld industry report with Five Forces diagram, S&P NetAdvantage industry survey, Passport consumer trend dashboard, and Bloomberg BI screen]
Practical Workflow: How to Conduct a Full Industry Audit Using Newman Library
Knowing the tools is only half the battle. A structured workflow ensures that you extract maximum value from each resource. The following step-by-step approach is designed for a typical industry analysis project focused on a North American market.
Step 1: Define the Scope and Classification. Begin by identifying the industry of interest and its official NAICS code. Use Newman Library’s NAICS lookup tool or the U.S. Census Bureau website. Also note the corresponding GICS sector and SIC code. For example, if analyzing the U.S. pharmaceutical industry, you would start with NAICS 325412 (Pharmaceutical Preparation Manufacturing) and map it to GICS 35202010 (Pharmaceuticals) and SIC 2834.
Step 2: Gather an Industry Overview. Open IBISWorld and search by the NAICS code. Read the executive summary, the industry definition, and the key external drivers. Note the market size, growth rate, and Porter’s Five Forces assessment. If a SWOT analysis is available, extract it for later use.
Step 3: Deepen with Financial and Competitive Data. Switch to S&P NetAdvantage and locate the corresponding GICS industry survey. Compare the financial ratios (e.g., operating margin, return on equity) with IBISWorld’s data. Use the "Industry Surveys" section to identify the top companies and their market shares. Then, if possible, visit the Bloomberg terminal in the Subotnick Financial Services Center and use the BI function to get real-time stock performance, recent analyst reports, and peer comparisons.
Step 4: Incorporate Macro and Consumer Perspectives. Use Fitch Solutions BMI to access a SWOT analysis and macroeconomic forecasts for the industry. If the industry has a strong consumer-facing component (e.g., beverages, retail), log into Passport and look for consumer expenditure data, brand loyalty metrics, and trend reports. This step adds the external environment layer that is often missing in pure financial databases.
Step 5: Synthesize and Validate. Compile all findings into a coherent narrative. Use the Gale Business: Insights database to search for recent trade journal articles that provide qualitative context—e.g., regulatory changes, technological innovations, or competitive moves. Finally, cross-check your conclusions with any relevant case studies or working papers available through the library’s catalog.
Step 6: Document and Cite. Record all sources and database names. Newman Library’s subject guides provide citation formats for these resources, which is especially useful for academic projects.
[IMAGE: Flowchart diagram showing six-step workflow: Define Scope → IBISWorld → S&P/Bloomberg → Fitch/Passport → Synthesize → Document]
Conclusion: Leveraging the Library for Strategic Advantage
The resources available through Newman Library at Baruch College offer an unparalleled foundation for industry analysis in North America. From the precise classification power of NAICS, SIC, and GICS to the depth of databases like Bloomberg Professional, IBISWorld, S&P NetAdvantage, Fitch Solutions BMI, and Passport, researchers have access to the same tools used by professional analysts at investment banks and consulting firms.
What sets Newman Library apart is the integration of these tools with academic support—librarians, research guides, and workshops that help users navigate the complexity. Whether you are applying Porter’s Five Forces to evaluate the competitive rivalry in the airline industry, using a Fitch SWOT analysis to assess opportunities in renewable energy, or tracking real-time market data on Bloomberg for a class project, the library’s ecosystem supports rigorous, data-driven decision-making.
In an era where information overload is as dangerous as information scarcity, the ability to systematically audit an industry using authoritative sources is a competitive advantage. By mastering the workflow outlined in this guide, students, faculty, and professionals can transform raw data into strategic insight—and make better decisions in the dynamic North American market.
[IMAGE: Illustration of a researcher standing in front of a large screen displaying an industry dashboard with charts, Five Forces diagram, and SWOT matrix, with the North American continent outline in the background]
Trade Metrics
Related Datasets
Q4 Cross-Border Logistics Report
PDF • 4.2 MB
Automotive Parts Supply Chain Index
CSV • 1.1 MB