The Great Data Center Migration: How Power, Land, and Policy Are Redrawing

David Thompson
Data Editor
March 21, 2026
DATELINE: NA TRADE WIRE
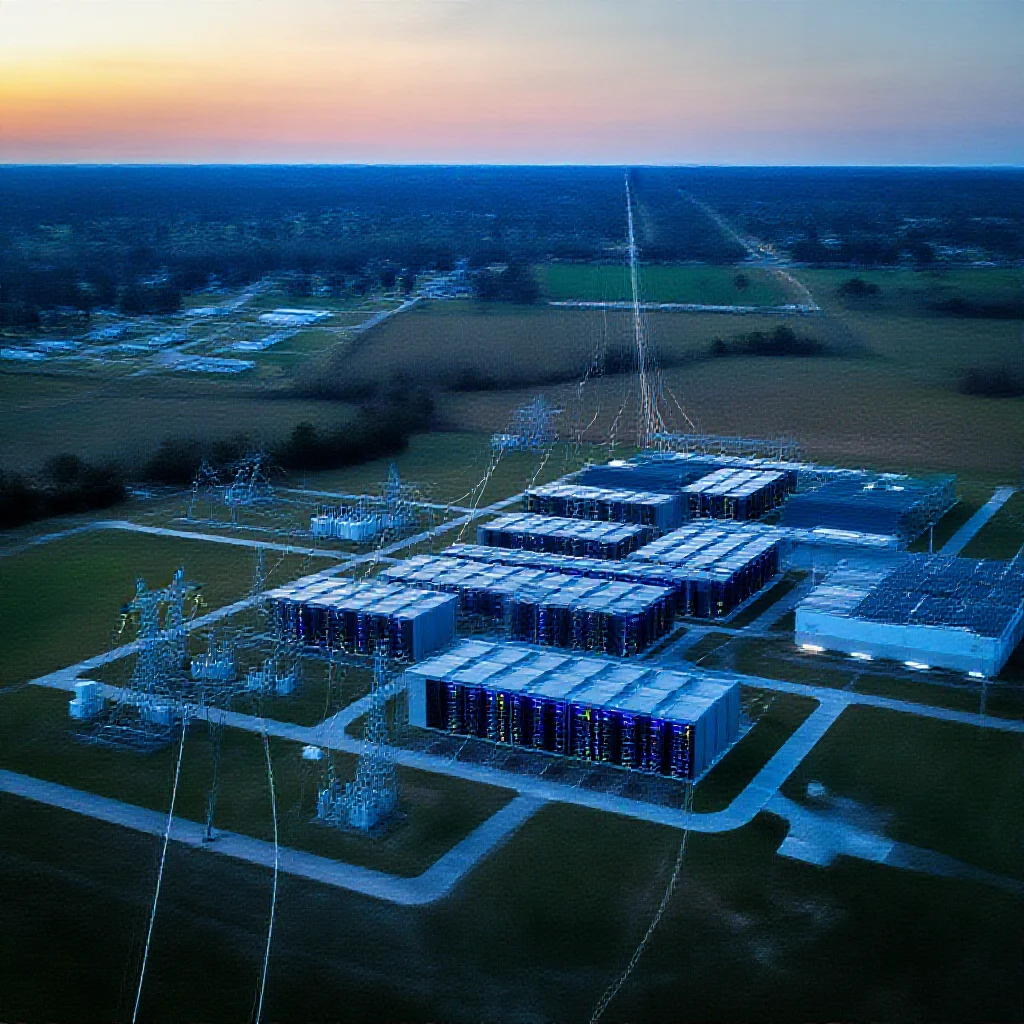
"The U.S. data center landscape is undergoing a significant geographic realignment,"
The Great Data Center Migration: How Power, Land, and Policy Are Redrawing America's Digital Map
Introduction: The New Geography of the Cloud
The archetypal image of digital infrastructure concentrated in Silicon Valley is obsolete. The U.S. data center landscape is undergoing a significant geographic realignment, moving beyond traditional coastal tech hubs. Market share data, measured by operational square footage, reveals a dynamic, state-by-state competition for digital infrastructure investment. This metric serves as the key indicator of deployed capacity and capital expenditure, providing a clear view of where the physical cloud is being built. The static map of American technology is being redrawn by forces of economics, physics, and policy.!A map of the United States with glowing nodes representing major data center hubs.
The Leader and The Challengers: A Snapshot of Q3 2023
As of the third quarter of 2023, the hierarchy of U.S. data center markets is defined by a clear leader and a tier of challengers. Virginia commands a dominant 25.7% of national operational square footage, solidifying its position as the undisputed core of digital infrastructure (Source 1: [Primary Data]). California and Texas form a secondary tier, but with diverging trajectories, holding 11.3% and 9.8% market share respectively. The cohort of rising contenders includes Georgia (5.8%), Arizona (4.8%), Ohio, and Oregon, states that have demonstrably gained market share in the current cycle.!An infographic bar chart comparing the market share percentages of the top 6 states.
The Great Divergence: Unpacking the Gainers vs. Losers
Analysis of market share movement reveals a clear geographic and economic divergence. States gaining share—Virginia, Texas, Georgia, Arizona, Ohio, Oregon—exhibit common characteristics: lower industrial energy costs, climates favorable for reduced mechanical cooling expenditure, business-friendly tax and regulatory environments, and abundant, affordable land for large-scale campus development.Conversely, states losing market share—including California, Illinois, New York, Washington, and Florida—face structural binds. These include some of the nation's highest energy costs, saturated and expensive real estate markets, more complex regulatory hurdles, and physical space constraints that limit hyperscale development. A case study contrast is evident between Texas's strategic growth, fueled by its independent power grid and land availability, and California's relative decline, where high operational costs and regulatory complexity redirect investment.
Beyond Square Footage: The Deep Drivers of Migration
The migration of data center square footage is a surface indicator of deeper, more fundamental drivers.The Power Grid Imperative: Access to affordable, reliable, and increasingly green energy is the primary decision factor. Hyperscale facilities consume power on par with small cities, making kilowatt-hour cost and procurement of sustainable power the most critical variable in site selection.
Latency vs. Cost: A constant balancing act exists between proximity to major internet exchanges and population centers (low latency) and the operational expense savings offered by secondary markets. Advances in network technology have expanded the acceptable radius from core connectivity hubs, enabling migration to lower-cost regions.
The Incentives Arms Race: State and local tax abatements on equipment, property, and sales tax are actively deployed to lure multi-billion dollar investments. This competition has become a standard part of the site selection calculus for developers and hyperscale operators.
Supply Chain & Risk Mitigation: A core strategy for major cloud providers is geographic diversification for resilience. Distributing infrastructure across multiple regions mitigates risk from natural disasters, regional grid instability, or other localized disruptions, directly fueling growth in new markets.
Verification and Context: Understanding the Data's Foundation
The market share analysis is based on operational data center square footage as of Q3 2023, a standard industry metric for measuring installed capacity (Source 1: [Primary Data]). This measurement focuses on live, revenue-generating space, making it a lagging but concrete indicator of where capital has been deployed. It does not capture announced projects or construction pipelines, which would further accentuate the growth trends in gaining states. The data reflects a point-in-time snapshot of a rapidly evolving landscape, where today's announced megaproject will alter future share calculations.Conclusion: Implications for Regional Economies and National Resilience
The ongoing migration of data center infrastructure has tangible implications. For gaining states, it represents substantial capital investment, high-skilled job creation in construction and operations, and a significant expansion of the tax base, albeit often negotiated through incentives. The increased concentration in certain regions, however, raises questions about local grid capacity and water resource management for cooling.For national technology resilience, a more geographically distributed infrastructure base reduces systemic risk. However, the concurrent trend of consolidation into massive campuses creates new points of concentrated demand on regional power and water utilities. The logical trajectory suggests continued growth in the Southeastern and Central U.S. corridors, driven by the immutable economics of power, land, and climate. The evolution of this map will be determined by which regions can sustainably balance the massive resource demands of this industry with the economic benefits it promises.
Trade Metrics
Related Datasets
Q4 Cross-Border Logistics Report
PDF • 4.2 MB
Automotive Parts Supply Chain Index
CSV • 1.1 MB