Beyond the National Average: How State-by-State Income Data Reveals America''s

David Thompson
Data Editor
April 18, 2026
DATELINE: NA TRADE WIRE
"An analysis of 2022 American Community Survey data reveals that the income"
Beyond the National Average: How State-by-State Income Data Reveals America's True Economic Geography
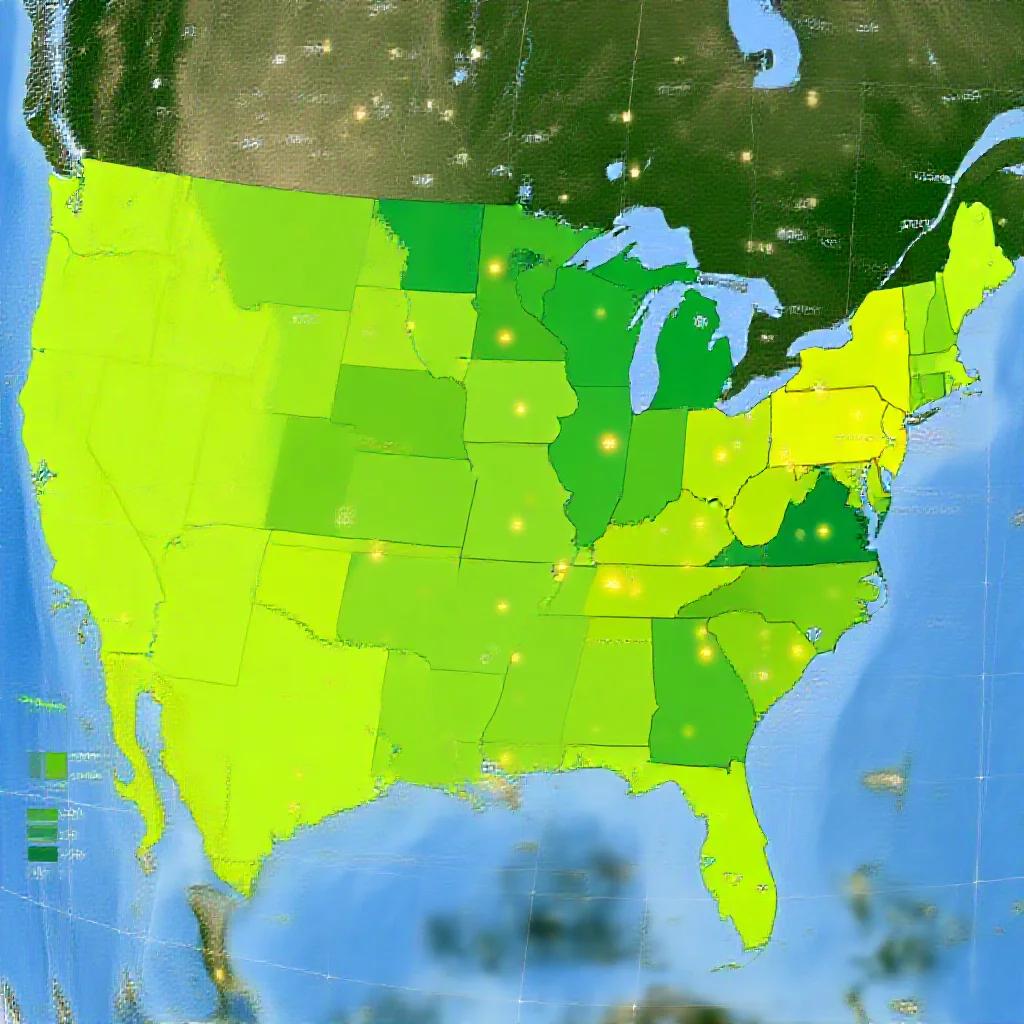
![A detailed, artistic map of the United States with varying shades of color representing different income thresholds, overlaid with subtle, glowing data points and faint grid lines suggesting economic analysis, viewed from a slightly elevated angle, photorealistic style, no text or watermarks.]()
Introduction: The Myth of a National Middle Class
A six-figure household income represents a middle-class lifestyle in Washington D.C. but qualifies as upper-middle class in Mississippi. This is the core finding of an analysis of 2022 income data, which reveals that the financial benchmarks for economic class are not national but intensely local. The income required to be considered upper-middle class—defined here as the 60th to 80th percentile of earners in a given area—varies from over $176,000 at the top end in D.C. to under $94,000 in Mississippi. These figures challenge the utility of a singular national narrative about the American middle class. This analysis moves beyond simple state rankings to audit the underlying economic geography and the structural forces that create such divergent financial realities.
![A split-image showing contrasting cityscapes (e.g., Washington D.C. skyline vs. a rural Mississippi town).]()
Decoding the Data: Methodology and Immediate Insights
The classification of "upper-middle class" in this context is a relative, not absolute, measure. It is defined as households earning between the 60th and 80th percentile of incomes within a specific state or district. This percentile-based approach controls for local economic conditions, making disparities between regions starkly apparent. The analysis is based on 2022 figures from the American Community Survey (ACS), a comprehensive demographic survey conducted by the U.S. Census Bureau (Source 1: [Primary Data]).
The immediate insights are clear. The District of Columbia sets the upper benchmark, with an upper-middle-class income range of $105,421 to $176,280. Mississippi defines the lower bound, with a range of $55,801 to $93,235. The gap between these extremes, approximately $83,000, is not marginal; it represents a profound difference in the economic structures governing daily life and financial security in these jurisdictions.
![An infographic-style visualization comparing the income ranges of D.C., Mississippi, and a national average.]()
The Hidden Economic Logic: What State Thresholds Really Measure
These income thresholds are less a direct measure of wealth and more a diagnostic tool for local economic ecosystems. They reflect the confluence of industry concentration, wage scales, and, critically, cost structures.
First, industry concentration dictates wage distribution. Jurisdictions with a high density of knowledge-intensive sectors—such as technology in California or professional services and federal governance in Washington D.C.—naturally exhibit elevated income percentiles. Conversely, states with economies more reliant on agriculture, tourism, or lower-wage manufacturing, like Mississippi, will have compressed income distributions.
Second, and most consequentially, these thresholds are intrinsically linked to local costs, particularly housing. A household at the 80th percentile in Mississippi has significantly less purchasing power parity than a household at the same percentile in D.C. when acquiring housing, services, or education. The income number itself is meaningless without this contextual anchor. The threshold is therefore a function of both the money entering households and the cost of maintaining a locally defined standard of living.
![A chart correlating state income thresholds with a key cost-of-living indicator like median home price.]()
Deep Audit: Long-Term Implications Beyond the Headlines
The divergence in state-level income thresholds signals deeper, long-term economic shifts with tangible implications.
One risk is the solidification of a "two-speed" national economy. As the financial experience of households in high-threshold and low-threshold states continues to diverge, it can exacerbate political and social divides, as policy priorities and economic perceptions become increasingly localized.
This divergence also directly influences talent migration and business location decisions. High thresholds often correlate with robust job markets in high-value sectors, attracting skilled labor, which in turn reinforces the economic cycle driving those high thresholds. This creates self-reinforcing cycles of concentration and outflow, affecting regional economic resilience.
From a market analysis perspective, these thresholds serve as leading indicators. They predict future demand curves for state-level services, real estate development, and educational investment. A state with a rising 80th percentile threshold will see different demand for luxury goods, professional services, and high-end housing than a state where the threshold is stagnant. This has downstream effects on supply chains, from construction materials to financial services, that cater to these distinct economic tiers.
![A conceptual image showing arrows of migration flowing between high-threshold and low-threshold states.]()
Conclusion: Rethinking Class in a Geographically Disparate Nation
The data concludes that economic class in the United States is a local construct. The lived experience of being "upper-middle class" is geographically contingent, defined by a household's position within a specific state's income distribution and cost matrix. This reality renders federal one-size-fits-all economic policies increasingly problematic, as a policy calibrated to the national median may be irrelevant or even counterproductive in high-cost or low-wage states.
Effective economic analysis and policymaking must therefore prioritize geographic granularity. Understanding America's economic health requires auditing it not as a monolithic entity but as a federation of disparate, interconnected economies. The state-by-state income thresholds are not just a ranking; they are a map of the nation's true economic geography, revealing the fault lines and peaks of its financial landscape. The future of economic mobility, business strategy, and public policy depends on reading this map correctly.
Trade Metrics
Related Datasets
Q4 Cross-Border Logistics Report
PDF • 4.2 MB
Automotive Parts Supply Chain Index
CSV • 1.1 MB