The 7.8-Year Divide: Decoding the Stark Life Expectancy Gap Between U.S. States

David Thompson
Data Editor
March 22, 2026
DATELINE: NA TRADE WIRE
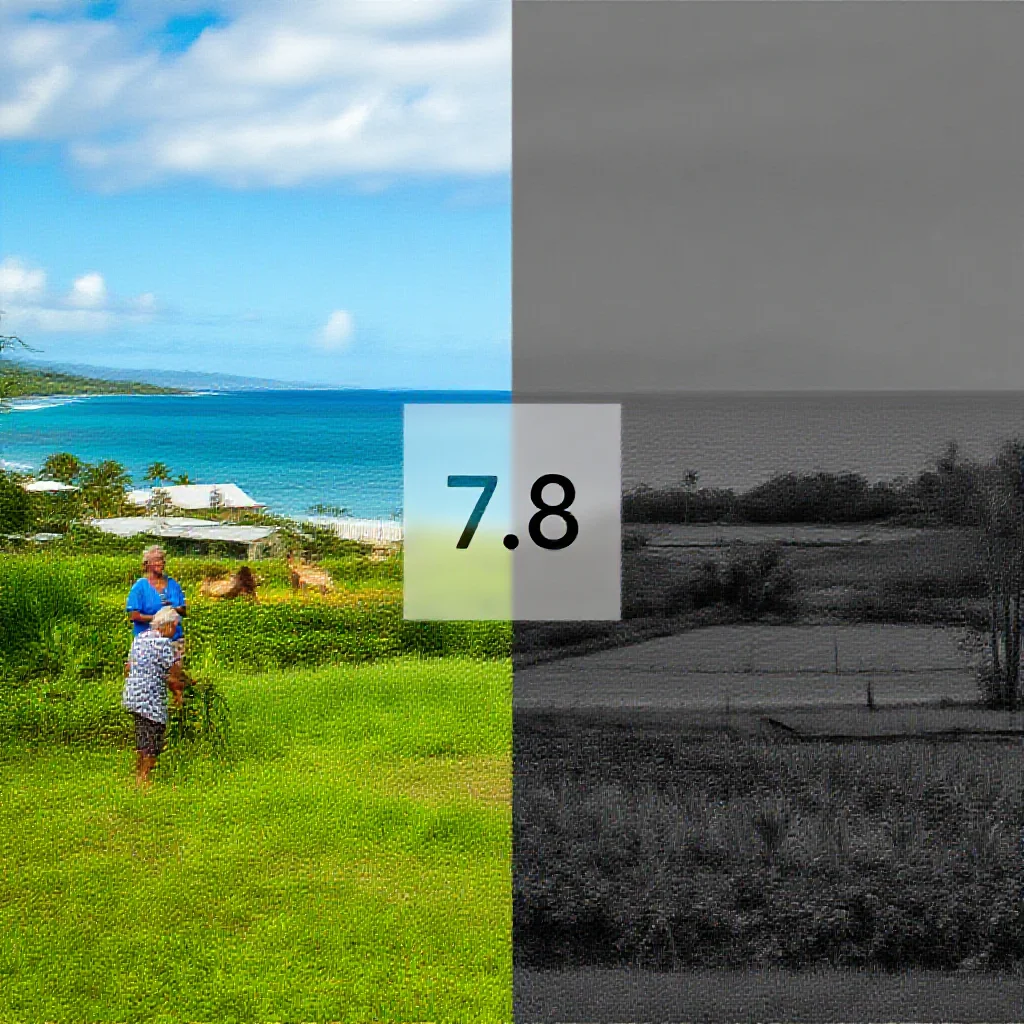
"CDC data reveals a staggering 7.8-year life expectancy gap between Hawaii"
The 7.8-Year Divide: Decoding the Stark Life Expectancy Gap Between U.S. States
A 7.8-year chasm separates the average resident of Hawaii from the average resident of Mississippi. According to data from the Centers for Disease Control and Prevention, life expectancy at birth stands at 80.7 years in Hawaii, the highest among U.S. states. In Mississippi, the figure is 72.9 years, the nation’s lowest (Source 1: [CDC/NCHS 2021 Data]). This disparity is not an isolated statistical anomaly but the peak of a pronounced geographical gradient. A clear regional pattern emerges from the data: states in the Southeast consistently report lower life expectancies, while states in the West and Northeast demonstrate a measurable advantage.
The Stark Geography of Longevity: Hawaii's Peak vs. Mississippi's Valley
The 7.8-year gap between state extremes represents a monumental public health differential. Epidemiologically, closing a gap of this magnitude would be equivalent to the cumulative survival gains from eradicating all forms of cancer. The geographical distribution of this data reveals a systemic, rather than random, phenomenon. The cluster of states with the lowest longevity is concentrated in the southeastern United States, including Mississippi, West Virginia, Louisiana, and Alabama. Conversely, the cohort with the highest longevity is dispersed along the Pacific coast and in the Northeast, including Hawaii, Washington, California, Minnesota, and Massachusetts. This map presents a first-order visualization of underlying structural determinants that transcend state borders.
Beyond Healthcare: The Syndemic of Drivers Behind the Gap
Attributing the life expectancy gap solely to variations in healthcare quality constitutes an analytical error. The divergence is better understood as a syndemic—the synergistic interaction of multiple, interconnected epidemics within a population. Three primary, interlocking drivers form a self-reinforcing cycle.
First, socioeconomic inequality functions as a foundational determinant. Disparities in median household income, educational attainment, and poverty rates directly correlate with health outcomes. Higher income expands access to healthier food, safer housing, and less environmentally stressful neighborhoods. Second, social and environmental determinants, including food security, reliable transportation, and exposure to environmental toxins, create the daily context for health. Third, behavioral factors such as smoking, physical inactivity, and obesity are significantly influenced by the preceding two categories; these behaviors are not merely individual choices but are shaped by available resources and environmental cues.
The cycle is vicious: economic constraint limits healthy choices and access to preventive care, leading to higher rates of chronic disease and premature mortality. Poor health, in turn, imposes medical debt and reduces earning capacity, deepening economic hardship. This syndemic explains why the gap persists despite universal technological advancements in medicine.
The Economic Logic of Lifespan: A National Dividend or Debt?
Life expectancy is a profound lagging indicator of economic and policy decisions made decades prior. The economic implications of a 7.8-year state-level gap are systemic and long-term. Regions with lower life expectancy face strained public pension systems, where a smaller working-age population supports a retiree cohort with a shorter benefit-collection period but higher end-of-life medical costs. Workforce productivity is diminished by higher rates of disability and absenteeism due to chronic illness.
State-level life expectancy can be analyzed as the output of an underlying "supply chain" of health. Inputs include historical investment in public health infrastructure, quality of K-12 and higher education, economic development policies, and the robustness of social safety nets. Disinvestment in these areas in one generation manifests as elevated mortality data in the next. Consequently, the divergence between states reflects a long-term divergence in the allocation of resources toward human capital development.
Bridging the Divide: Lessons from High-Performing States and Future Trajectories
High-performing states do not share a single political or demographic profile but exhibit common strategic investments. These include broader Medicaid expansion under the Affordable Care Act, which improves financial access to primary care; higher per-pupil education spending, which correlates with long-term health literacy and economic mobility; and comprehensive public health initiatives targeting smoking cessation, obesity, and substance abuse. The effectiveness of these measures is not instantaneous but accrues over decades.
Future trends will be dictated by the interaction of demographic shifts, climate effects, and policy continuity. The migration of populations from lower- to higher-longevity states may temporarily mask regional disparities in national averages while exacerbating economic pressures on receiving states. Furthermore, the increasing frequency of extreme weather events poses a disproportionate threat to the public health infrastructure of Southeastern states, potentially widening the gap if adaptation investments are not made.
Market and industry predictions indicate a growing focus on geographic health risk. Insurers, both health and life, are likely to further refine pricing models based on granular location data, reflecting the actuarial reality of zip-code-level mortality. Employers may face increasing pressure to adjust benefits and wellness programs for regional workforce health profiles. The sustainability of a unified national economy is challenged by such deep and persistent divisions in the most fundamental measure of human capital: lifespan. The 7.8-year gap is therefore not merely a health statistic but a key metric for long-term national resilience.
Trade Metrics
Related Datasets
Q4 Cross-Border Logistics Report
PDF • 4.2 MB
Automotive Parts Supply Chain Index
CSV • 1.1 MB