Beyond the Rankings: The Hidden Economic and Social Drivers Behind U.S. States'

David Thompson
Data Editor
April 20, 2026
DATELINE: NA TRADE WIRE
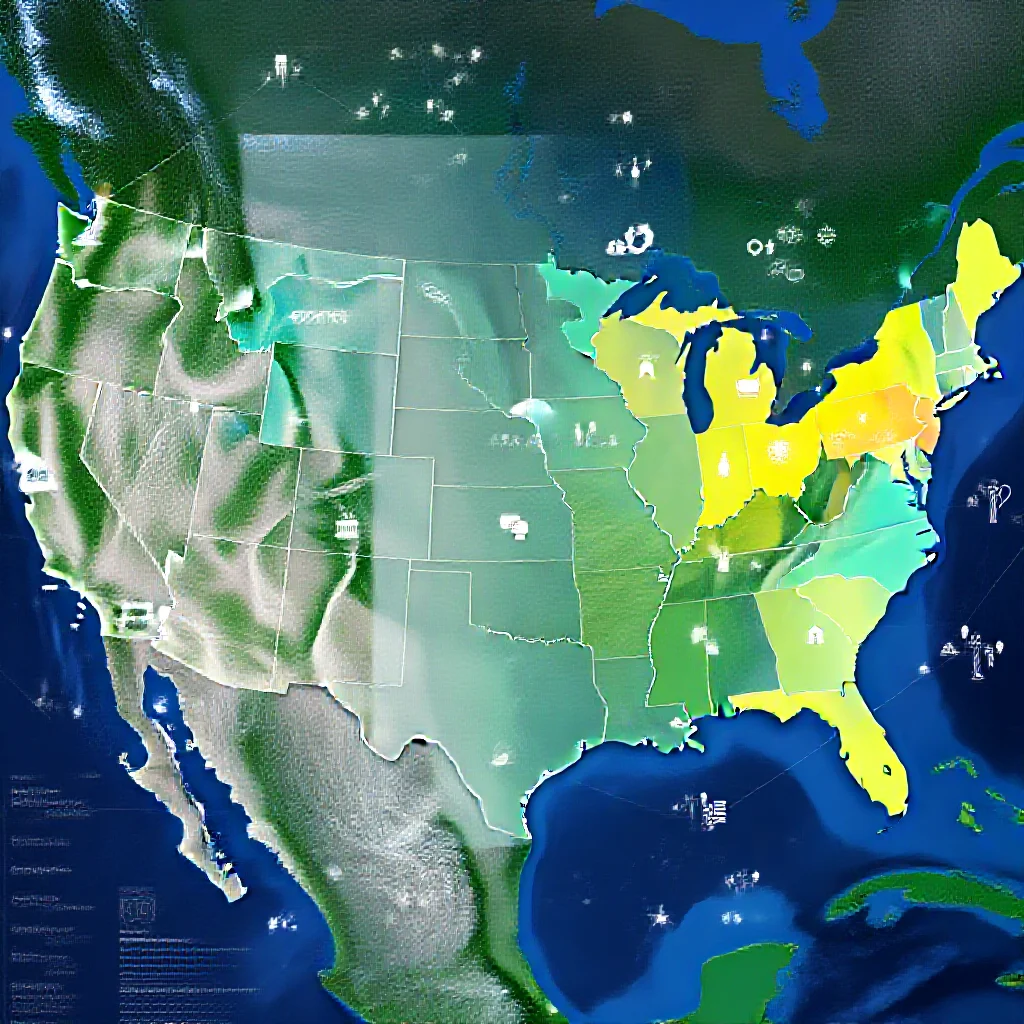
"While Massachusetts leads the 2024 U.S. News & World Report''s Best States"
Beyond the Rankings: The Hidden Economic and Social Drivers Behind U.S. States' Quality of Life
Introduction: The Ranking as a Diagnostic Tool, Not a Trophy
The 2024 U.S. News & World Report Best States rankings present a hierarchical view of state performance across eight categories: health care, education, economy, infrastructure, opportunity, fiscal stability, crime & corrections, and natural environment. Massachusetts secured the top overall position. However, these rankings function less as a simple trophy case and more as a diagnostic tool, revealing the underlying strategic priorities and inherent trade-offs in state governance. The analysis is grounded in core data sources, including McKinsey & Company’s analysis of the U.S. Census Bureau’s 2022 American Community Survey and data from the U.S. Bureau of Labor Statistics (Source 1: [Primary Data]). This foundation shifts the narrative from identifying winners to decoding competing models of American development.
The Massachusetts Model: Betting Everything on Human Capital
Massachusetts’s first-place overall rank is directly attributable to its leading positions in the Education and Health Care categories. The state’s model demonstrates a clear economic logic: sustained, high investment in human capital cultivates a highly skilled and healthy workforce. This workforce, in turn, attracts and sustains knowledge-economy businesses in sectors like biotechnology, finance, and higher education, creating a self-reinforcing cycle of innovation and high productivity. The long-term fiscal stability implied by this model is supported by a robust tax base derived from high-value industries. However, this analysis must consider trade-offs not fully captured in the ranking categories. The model correlates with a high cost of living and significant economic inequality, factors that can offset measured gains in opportunity and quality of life for segments of the population.
Divergent Paths to Prosperity: Specialists vs. Generalists
The rankings reveal states that excel as "specialists," leading in single categories through distinct strategic focuses, thereby illustrating divergent paths to prosperity.
* Utah (Economy): Leading the economy category suggests a development recipe combining business-friendly regulatory policies, a comparatively young and growing workforce, and successful diversification into technology and professional services. The state’s fiscal stability often benefits from this economic vitality, demonstrating a linkage between categories.
* Nevada (Infrastructure): A top rank in infrastructure underscores a strategic priority on the physical foundations critical for its dominant industries—tourism and logistics. This includes investments in airports, highways, and convention facilities. The model’s stability, however, is inherently tied to the cyclical nature of tourism and consumer discretionary spending.
* Minnesota (Opportunity): Leading in opportunity indicates performance metrics related to economic equality, affordability, and social mobility. This suggests a policy emphasis on social infrastructure, such as access to healthcare and education, which may complement rather than conflict with economic growth, aiming for a more equitable distribution of prosperity.
* Alaska (Natural Environment): The paradox of Alaska leading in natural environment while often facing fiscal challenges highlights a unique quality-of-life calculus. The category measures air and water quality, pollution, and environmental integrity. Alaska’s vast wilderness provides a high score, but the state’s economy and fiscal stability have historically been dependent on managing the extraction of natural resources, presenting a constant tension between the measured "natural environment" and economic foundations.
The Unseen Foundation: Data Sources and What They Hide
The credibility of any ranking is anchored in its data sources. The 2024 rankings rely on McKinsey’s analysis of the 2022 American Community Survey (Census) and Bureau of Labor Statistics data (Source 1: [Primary Data]). This reliance introduces specific analytical parameters and limitations. A significant time lag exists, with 2022 data informing a 2024 ranking, a period which included substantial economic shifts. Furthermore, the selected eight categories, while comprehensive, omit harder-to-quantify metrics critical to quality of life, such as social cohesion, civic engagement, and granular housing affordability stress. The true analytical power lies not in any single metric but in observing the interactions within the combined dataset—for example, how a leading economy score (Utah) correlates with fiscal stability over time, or how investment in opportunity (Minnesota) may influence long-term economic resilience.
Conclusion: Rankings as a Map of Competing Visions
The 2024 Best States rankings provide a structured, data-informed snapshot of relative state performance. The logical deduction from this data is that there is no singular formula for high quality of life. Instead, the rankings map a landscape of competing visions: the human capital-intensive model of Massachusetts, the business-growth focus of Utah, the infrastructure-dependent approach of Nevada, and the equity-oriented framework suggested by Minnesota’s opportunity lead. Future trends will likely be determined by how these models adapt to macro forces such as demographic shifts, climate physical risk, and the evolving geography of remote work. The most resilient states may be those that can strategically balance the trade-offs inherent in their chosen path, using data not as a final grade but as a guide for navigating the complex calculus of sustainable development.
Trade Metrics
Related Datasets
Q4 Cross-Border Logistics Report
PDF • 4.2 MB
Automotive Parts Supply Chain Index
CSV • 1.1 MB