Beyond the Rankings: The Hidden Economic and Strategic Drivers Behind Global

David Thompson
Data Editor
March 28, 2026
DATELINE: NA TRADE WIRE
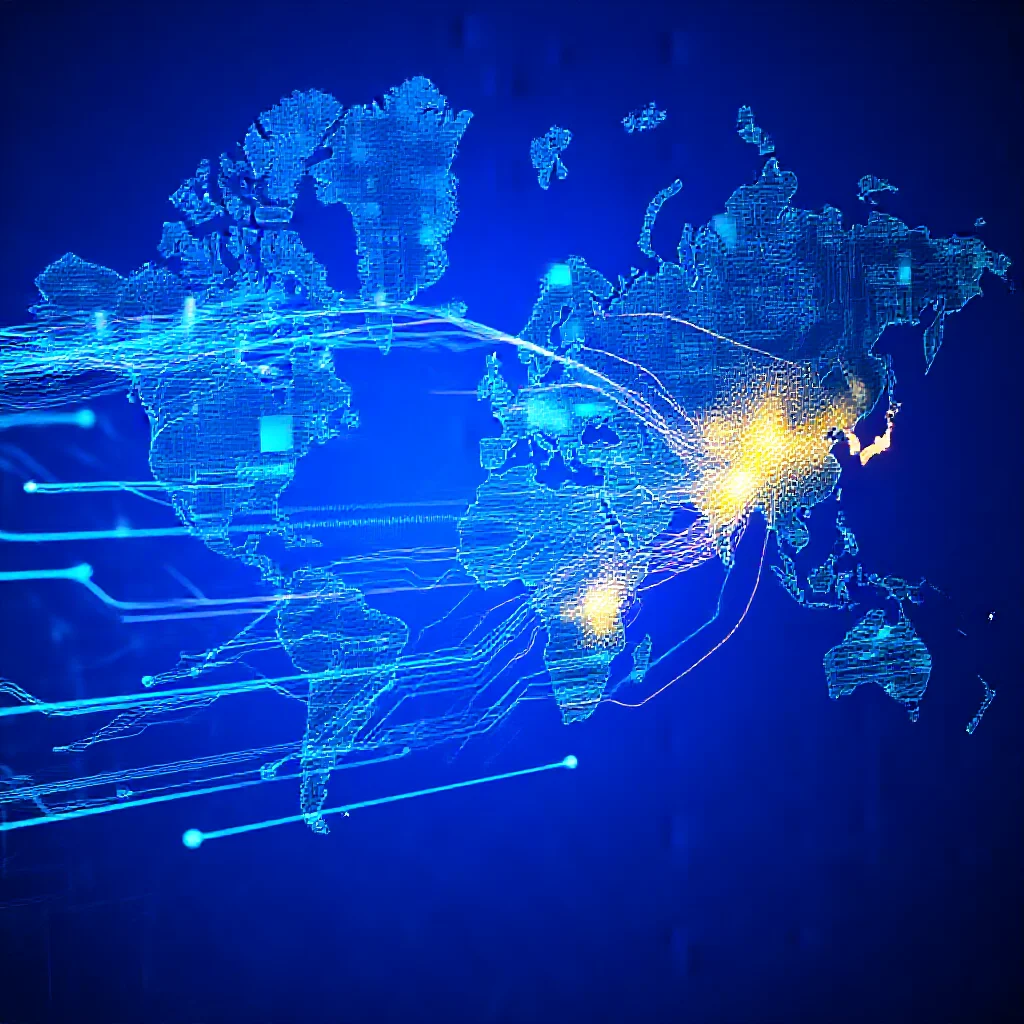
"While Taiwan, South Korea, and Japan top the 2023 PCT patent applications"
Beyond the Rankings: The Hidden Economic and Strategic Drivers Behind Global Patent Density Leaders
The Surface Ranking: A Snapshot of Global Innovation Intensity
The 2023 data from the World Intellectual Property Organization (WIPO) provides a clear hierarchy of national innovation intensity. The ranking of Patent Cooperation Treaty (PCT) applications per million people reveals a distinct cluster of East Asian economies at the apex. Taiwan leads with 4,751 applications per million people, followed by South Korea with 2,988, and Japan with 2,063 (Source 1: [WIPO Data 2023]). Switzerland ranks fourth with 1,968, while China and the United States, despite leading in absolute application volume, place fifth and sixth with 1,657 and 1,270 per million people, respectively.
The patents-per-capita metric functions as a normalized indicator of a nation’s embedded innovation culture and the specialized focus of its economy. It measures not merely the scale of research and development expenditure, but the efficiency and output orientation of a country’s innovation ecosystem relative to its population. This ranking shifts the narrative from sheer economic mass to concentrated technological capability, highlighting how smaller, focused economies can generate disproportionate intellectual property output.
!Infographic bar chart comparing the top 6 countries by PCT applications per million people

Decoding the Leaders: Three Distinct Models of IP-Centric Growth
The dominance of Taiwan, South Korea, and Japan is not monolithic; it is the result of three divergent strategic models.
Taiwan’s Defensive Pivot: Taiwan’s leading position is inextricably linked to its global semiconductor supremacy. This density reflects a strategic evolution from a pure-play manufacturing hub to an intellectual property fortress. Geopolitical pressures and the critical nature of its position in the advanced logic chip supply chain have compelled its flagship firms, most notably TSMC, to aggressively secure patents. This IP portfolio serves as both a defensive moat against competition and a form of strategic leverage, embedding Taiwan’s indispensability within global technology networks through legally protected innovation.
South Korea’s Conglomerate Engine: South Korea’s high patent density is a direct output of its chaebol-driven economic structure. Conglomerates like Samsung, LG, and Hyundai operate vertically integrated innovation ecosystems that span from fundamental materials research to consumer product design. Their vast, continuous R&D investments, aimed at maintaining leadership in semiconductors, displays, batteries, and automotive technology, result in systematic and high-volume patent filings. The national metric is thus a aggregation of corporate strategy, where IP is a key asset in global market competition.
Japan’s Cultural Transformation: Japan’s ranking signifies a corporate and institutional culture in transition. The traditional model of lifetime employment within large keiretsu, with its closed, incremental R&D, is being supplemented by a push for open innovation. Government policy and corporate necessity are fostering university spin-offs, venture capital investment, and cross-industry collaboration. The resulting patent output increasingly includes breakthroughs from startups and public-private partnerships, marking a shift from legacy strength to new frontiers in areas like robotics, biotechnology, and advanced materials.
The Geopolitical and Supply Chain Calculus Behind Patent Density
High patent density represents a sophisticated form of economic strategy, particularly for smaller nations. It functions as a form of non-military deterrence and bargaining power. For economies like Taiwan and South Korea, a dense web of patents in critical technologies translates to structural power within global supply chains. Their leadership is not incidental; it is mapped directly to chokepoint technologies—extreme ultraviolet lithography, advanced memory, OLED displays, and electric vehicle battery components. Patent dominance in these areas creates high barriers to entry and solidifies their roles as indispensable nodes.
This specialization, however, introduces a vulnerability paradox. While a deep IP portfolio creates resilience through technological indispensability, it also concentrates risk. An economy overly specialized in a single technological domain, no matter how advanced, becomes exposed to sector-specific downturns, disruptive technological shifts, and the geopolitical weaponization of trade and knowledge flows. The era of export controls and potential tech decoupling presents a dual-edged scenario: high patent density can be a shield, protecting core technologies, but the concentration it reflects can also be a target.
!A conceptual map showing global tech supply chains with key nodes highlighted in East Asia
What the Ranking Fails to Capture: Quality, Commercialization, and Future Trajectories
The per-capita ranking is a measure of output intensity, not necessarily impact. It does not distinguish between a foundational patent that defines an industry standard and an incremental improvement. The ultimate economic return on innovation is determined by the commercialization rate and market success of patented inventions, metrics where the United States and parts of Europe historically exhibit strength. Furthermore, the data reflects past R&D investments with a typical multi-year lag, making it a trailing indicator of innovative activity.
Future trajectories will be shaped by several factors. China’s rapid ascent in this ranking, given its population scale, indicates a massive, state-directed mobilization of R&D resources that may reshape global IP landscapes in the next decade. The strategic focus of patenting is also shifting, with artificial intelligence, quantum computing, and green technologies becoming the new battlegrounds. Nations that lead in patent density for these emerging fields will likely dictate the next phase of technological and economic influence.
Conclusion: A New Map of Global Technological Influence
The WIPO patents-per-capita ranking redraws the map of global innovation influence. It demonstrates that in the knowledge-based economy, concentrated technological mastery can rival the advantages of scale and resource endowment. The leadership of Taiwan, South Korea, and Japan is a story of strategic adaptation—to geopolitical pressures, global market competition, and internal economic restructuring. Their high patent densities are less a static achievement and more a dynamic, ongoing strategy to secure economic sovereignty, leverage in global supply chains, and long-term resilience. As technological competition intensifies, this metric will increasingly serve as a leading indicator of a nation’s strategic positioning within the fragile architecture of global innovation.
Trade Metrics
Related Datasets
Q4 Cross-Border Logistics Report
PDF • 4.2 MB
Automotive Parts Supply Chain Index
CSV • 1.1 MB