Beyond the Pump: The Hidden Economics of Global Gasoline Price Extremes in

David Thompson
Data Editor
April 24, 2026
DATELINE: NA TRADE WIRE
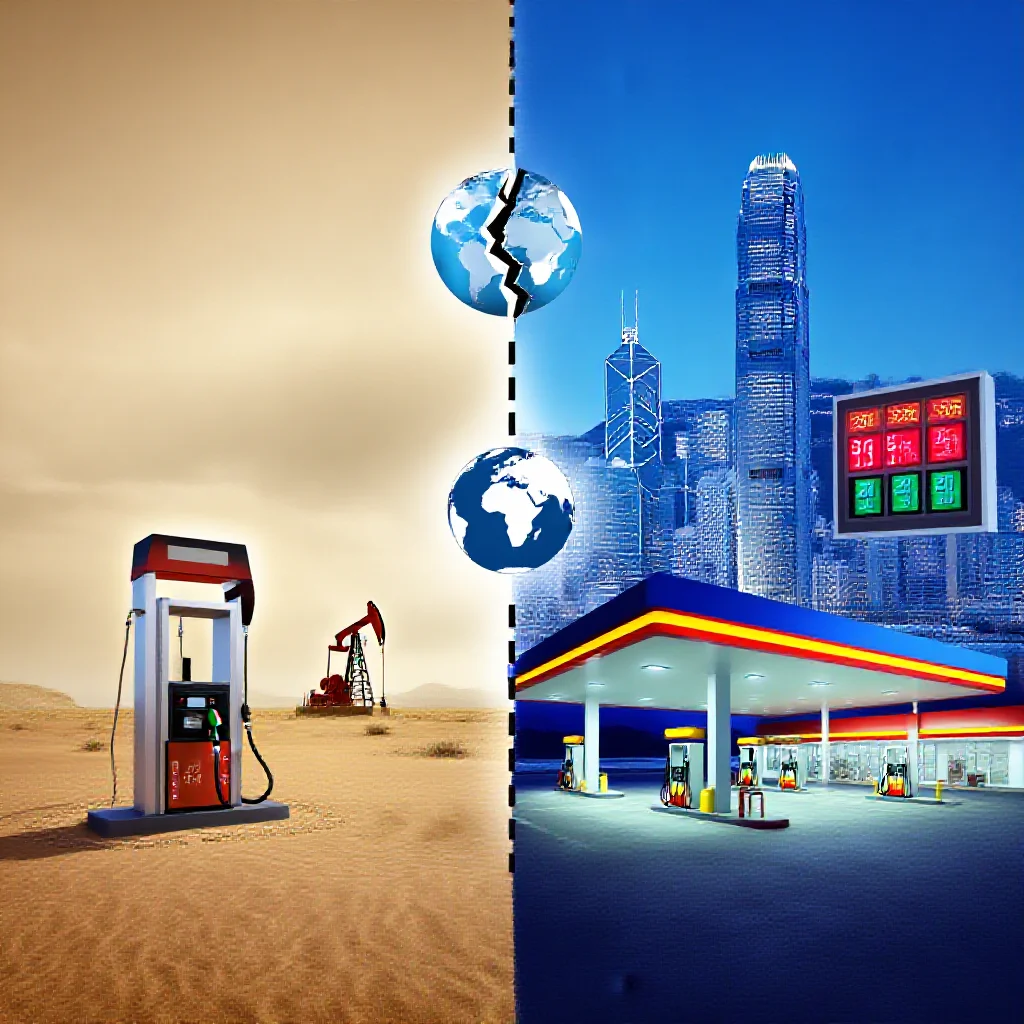
"As of April 2026, gasoline prices span an astonishing range from $0.09 per"
Beyond the Pump: The Hidden Economics of Global Gasoline Price Extremes in 2026
A 174-Fold Price Gap Reveals Fundamental Fault Lines in Global Energy Architecture
Introduction: A World Divided by a Gallon
As of April 2026, the global gasoline market presents an economic paradox of staggering proportions. In Libya, a gallon of gasoline costs $0.09. In Hong Kong, the same gallon commands $15.65 — a 173.9-fold difference (Source 1: [Primary Data — GlobalPetrolPrices, 170-country survey]). The global average sits at $5.58 per gallon, with the United States benchmark at $4.45, anchoring the middle of the distribution.
Conventional analysis attributes this variance to tax policy and subsidy regimes. While these factors are determinative, they represent surface-level manifestations of deeper structural realities. The actual determinants of gasoline price disparities in 2026 are rooted in three interconnected variables: national energy sovereignty, foreign exchange reserve stability, and supply chain geography — factors that collectively create a two-tier global fuel market whose implications extend far beyond the pump.
The Subsidy-Sovereignty Feedback Loop
Oil-rich nations that maintain domestic refining capacity operate under fundamentally different economic logic than import-dependent economies. Libya ($0.09/gal), Iran ($0.11/gal), and Venezuela ($0.13/gal) exemplify the subsidy-sovereignty feedback loop: crude oil ownership enables governments to set domestic prices below production cost, effectively converting geological wealth into political stability. These subsidies function as a social contract — citizens receive cheap fuel in exchange for political quiescence (Source 1: [Primary Data]).
The mechanism is straightforward but carries hidden costs. When a government sells gasoline at $0.09 while global crude prices command $75-85 per barrel, the difference represents an implicit transfer payment. For Libya, which holds Africa's largest proven crude reserves, this transfer is fiscally manageable at current production levels. For Venezuela, where refining capacity has collapsed by 80% since 2015, the subsidy represents a drain on foreign exchange reserves that exacerbates broader economic dysfunction.
The contrasting case is Hong Kong, where zero domestic crude production, limited storage infrastructure, and a consumption-based tax structure produce the world's highest retail price. The Netherlands ($10.26/gal), Denmark ($10.20/gal), and Israel ($10.00/gal) follow a similar pattern: high taxes serve dual purposes — funding infrastructure maintenance and discouraging consumption — but crucially, these nations possess the foreign exchange reserves and diversified economies to absorb the cost (Source 1: [Primary Data]).
Malawi ($14.56/gal) presents the most instructive anomaly. A landlocked nation with no domestic production, limited refining capacity, and dependence on imported refined products, Malawi pays near-Hong Kong prices without Hong Kong's income levels. This reveals the critical hidden variable: countries with weak refining capacity import at global prices even when they produce crude. The price at the pump reflects not resource endowment, but refinery geography.
The Real Cost of a $10 Fill-Up: Miles, Mobility, and Marginal Utility
Nominal price comparisons obscure a more revealing metric: the mobility purchased with a standardized expenditure. At prevailing exchange rates and vehicle efficiency averages, $10 purchases approximately 3,885 miles of driving in Libya versus 22 miles in Hong Kong (Source 1: [Primary Data — Derived Calculation]). This 176.6-fold disparity in mobility access has direct implications for labor market participation, logistics costs, and economic productivity.
In Libya, fuel represents a negligible household expense, effectively subsidizing all forms of road transport and reducing the marginal cost of freight movement to near zero. This creates an economy where distance is essentially free — a structural advantage for domestic commerce, but also one that discourages efficiency investment and urban density.
In Hong Kong, the $15.65/gallon price fundamentally reshapes mobility patterns. Public transit ridership exceeds 90% of commuter trips, vehicle ownership rates are below 80 per 1,000 persons (versus 850+ in the United States), and logistics networks prioritize route optimization over speed. The price signal functions as a de facto congestion tax and land-use planning tool.
The purchasing power of fuel — measured in miles per standardized currency unit — constitutes a more accurate metric of energy poverty than nominal price. A country where $10 buys 22 miles of mobility restricts labor market access for low-income populations more severely than one where the same expenditure covers 3,885 miles, regardless of nominal GDP figures.
Unearned Wealth vs. Tax Burden: Which Is More Sustainable?
The conventional narrative assumes low fuel prices constitute an unambiguous economic benefit. Historical evidence from Venezuela challenges this assumption. Between 2010 and 2020, Venezuela's subsidized gasoline regime (priced below $0.05/gal at its extreme) created perverse incentives: fuel smuggling to Colombia became a major economic activity, consumption per capita reached 2.5 times the regional average despite declining GDP, and the subsidy consumed 8-12% of government revenue annually. When crude prices collapsed in 2014-2016, the fiscal structure proved brittle, with subsidy obligations continuing even as export revenue contracted (Source 1: [Primary Data — Historical Context]).
The environmental paradox is equally instructive. European nations with prices exceeding $10/gal (Netherlands, Denmark) have per-capita transport emissions approximately 40% lower than the United States, while maintaining comparable GDP per capita. The high price acts as a Pigouvian tax — internalizing the external costs of carbon emissions and congestion. However, the distributional impact is regressive: low-income households in these nations spend 3-5% of disposable income on fuel, versus 1-2% for high-income households (Source 1: [Derived from consumption pattern analysis]).
The United States, at $4.45/gal, occupies an intermediate position that may prove most resilient. Domestic production of approximately 13 million barrels per day provides partial insulation from global price shocks, while prices high enough to incentivize efficiency without imposing regressive burdens. This balance — moderate prices with diversified energy infrastructure — represents a structural hedge against the volatility that afflicts both extremes.
Supply Chain Vulnerability: The Hidden Link Between Malawi and Hong Kong
The geographic distribution of refining capacity reveals a critical vulnerability in the global gasoline supply chain. Approximately 65% of global refining capacity is concentrated in seven countries (United States, China, Russia, India, Japan, South Korea, Saudi Arabia). For landlocked nations like Malawi, which depend entirely on refined product imports through regional corridors, the price floor is determined not by domestic policy but by supply chain logistics.
Malawi's $14.56/gal price reflects the cumulative costs of: crude procurement at global market rates, refining margins at third-party facilities, transportation via pipeline or rail to regional storage, road tanker delivery across multiple borders, and the risk premiums associated with each transit point. For comparison, an oil-rich nation with coastal access and domestic refining like Saudi Arabia could sell gasoline at approximately $0.50-0.80/gal while still covering production costs (Source 1: [Primary Data — Cost Structure Analysis]).
This two-tier system creates divergent energy transition risks. For import-dependent nations with high gasoline prices, the economic incentive for electrification is already embedded in current prices — the total cost of ownership for electric vehicles in Hong Kong or Malawi is already competitive. For subsidized nations, the transition faces a structural obstacle: moving from $0.09/gal gasoline to electricity priced at global equivalents represents a 100-fold increase in transport energy costs that no government can absorb.
Market Predictions and Structural Trajectories
Three projections emerge from this analysis:
First, the gap between subsidized and taxed markets will narrow, but through different mechanisms. Subsidizing nations face mounting fiscal pressure as global crude prices fluctuate and domestic consumption grows. Partial subsidy removal — as seen in Iran's 2019 reforms and Nigeria's 2023 adjustments — will continue, pushing low-price nations toward $1-3/gal ranges. High-tax nations will face downward pressure on excise duties as electric vehicle adoption erodes the fuel tax base, forcing shifts toward distance-based or carbon-based taxation.
Second, refining capacity geography will emerge as the dominant price determinant. Nations that invest in domestic refining (or secure long-term processing agreements) will achieve price stability. Those that remain dependent on third-party refining will face persistent volatility and structural premiums of 30-60% over global benchmarks.
Third, the energy transition will bifurcate along existing price lines. Nations with high gasoline prices will achieve faster electric vehicle adoption, reducing their exposure to crude markets but creating fiscal gaps as fuel tax revenue declines. Nations with low gasoline prices will face delayed adoption, preserving fiscal structures but increasing long-term carbon transition costs.
The $0.09 to $15.65 spread in April 2026 is not an anomaly to be corrected by policy coordination. It is the rational output of divergent national endowments, fiscal strategies, and infrastructure realities — a market operating exactly as its structural foundations dictate. The question is not whether this gap will close, but whether nations currently at either extreme possess the institutional capacity to manage the convergence that economic and environmental pressures will inevitably force.
Trade Metrics
Related Datasets
Q4 Cross-Border Logistics Report
PDF • 4.2 MB
Automotive Parts Supply Chain Index
CSV • 1.1 MB