Beyond the Numbers: The Hidden Architecture of Berkshire Hathaway''s 60-Year

David Thompson
Data Editor
March 27, 2026
DATELINE: NA TRADE WIRE
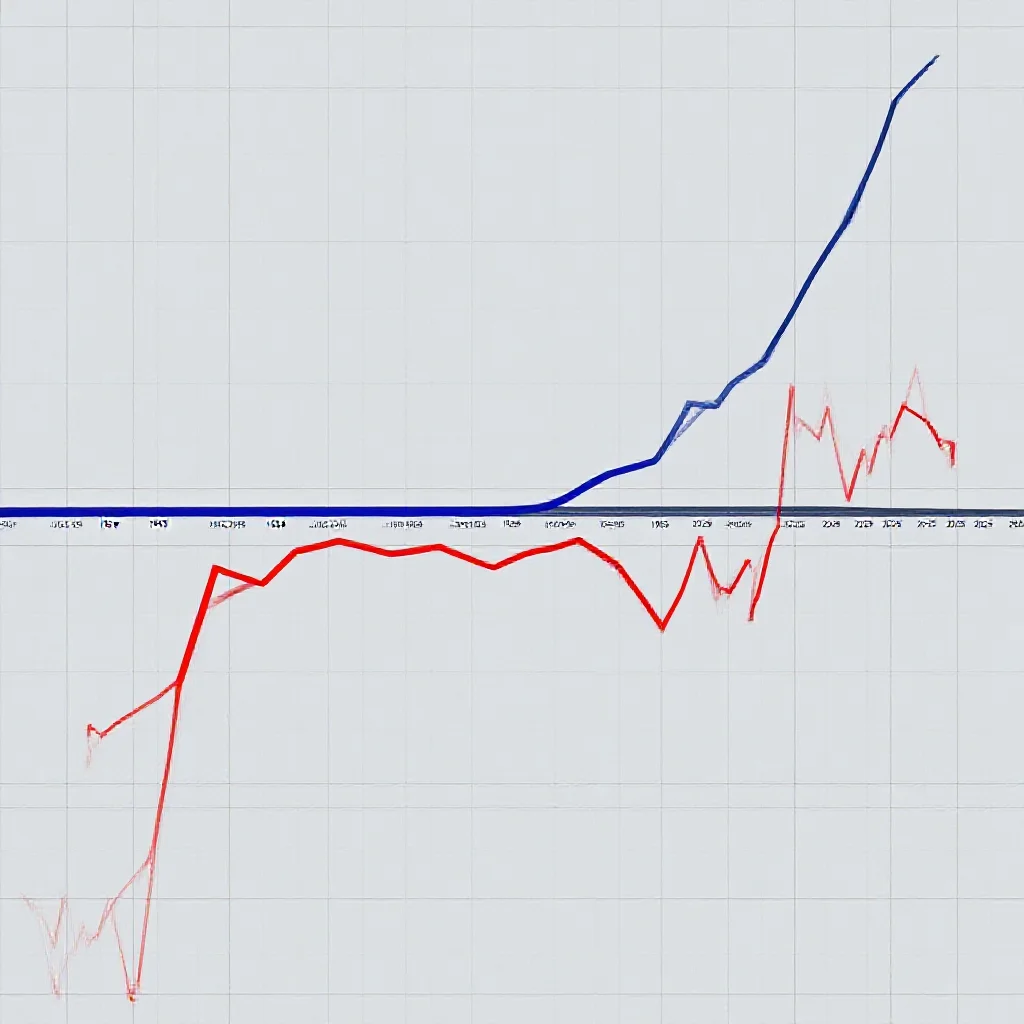
"While the headline figures—a $100 investment growing to $6.1 million versus"
Beyond the Numbers: The Hidden Architecture of Berkshire Hathaway's 60-Year Dominance Over the S&P 500
The Staggering Arithmetic: A 60-Year Performance Duel
The foundational data presents a stark divergence in capital growth. An investment of $100 in Berkshire Hathaway in 1965 would have grown to approximately $6.1 million by 2025. The same investment in the S&P 500, with dividends reinvested, would have yielded about $45,500 (Source 1: [Primary Data]). This outcome stems from a compounding rate differential: Berkshire Hathaway’s per-share market value compounded at an annual rate of 19.7%, nearly double the S&P 500’s total return of 10.5% (Source 1: [Primary Data]). The long-term impact of this differential is monumental. A critical nuance is that the S&P 500’s total return figure already includes reinvested dividends, the primary mechanism for shareholder return in a passive index. Berkshire Hathaway, which has never paid a dividend, achieved its superior market-value growth purely through capital appreciation and retained earnings, making its outperformance a function of corporate capital allocation rather than shareholder yield.!Infographic comparing the growth curves of $100 in BRK vs. SPX from 1965-2025
Deconstructing the 'Buffett Premium': The Structural Edge
The performance gap cannot be fully explained by superior stock selection alone. It is underpinned by a unique structural architecture, a "Buffett Premium," engineered into Berkshire Hathaway’s corporate form.First, the model benefits from permanent capital. As a publicly traded holding company, Berkshire is not a fund subject to investor redemptions. This eliminates a significant behavioral and operational drag on performance, allowing for truly long-term investment decisions without the need to maintain liquidity for potential withdrawals. Furthermore, shareholders compound wealth without paying recurring management or performance fees, a hidden but persistent tax on typical investment fund returns (Source 1: [Primary Data]).
Second, the strategic use of insurance float provides a decisive advantage. Float—premiums collected upfront before claims are paid—constitutes long-term, low-cost, and often negatively-costed capital. This leverage is not available to the S&P 500 index itself and provides Berkshire with a durable capital base to deploy during market dislocations.
Third, the owner-operator model contrasts fundamentally with the index constituent model. Companies within the S&P 500 are passive constituents; their collective performance is an average outcome. Berkshire operates as an active, strategic allocator of capital across wholly-owned operating businesses and minority public holdings. This transforms the corporation from a portfolio of stocks into a capital allocation machine.
!Diagram illustrating the flow of capital within Berkshire Hathaway's ecosystem
The Asymmetry of Wins and Losses: A Behavioral Blueprint
Consistency provided a foundation, but asymmetry drove the extraordinary results. Berkshire posted positive returns in 50 of the 61 years, demonstrating resilience (Source 1: [Primary Data]). The defining characteristic, however, was the scale of gains during winning years. Berkshire’s average gain in positive years was 32%, compared to the S&P 500’s average gain of 19% in its own up years (Source 1: [Primary Data]).This differential reveals a blueprint of engineered positive convexity: the corporate structure and managerial discipline were designed not merely for more frequent gains but for larger magnitude gains when correct. This asymmetry was achieved through a counter-cyclical investment approach—deploying significant capital during periods of market fear and pessimism, as encapsulated in Warren Buffett’s axiom to "be fearful when others are greedy." The permanent capital base and insurance float provided the operational capacity to act on this discipline at scale, allowing Berkshire to place larger bets during market troughs than a typical, capital-constrained entity could.
!Bar chart comparing average gain in 'up years' for BRK and SPX
The Modern Challenge: Why the Gap Narrowed (2015-2025)
The historical architecture faced a significant stress test in the decade from 2015 to 2025. During this period, the S&P 500 returned 304%, outperforming Berkshire Hathaway’s 234% return (Source 1: [Primary Data]). This narrowing of the performance gap signals a shift in the market environment that challenged Berkshire’s core model.The primary reason is the rise of mega-cap technology dominance. The S&P 500’s performance became increasingly driven by a concentrated group of technology and growth-oriented companies, such as Apple, Nvidia, and Meta. These firms achieved exponential growth rates that surpassed the steady, high-return-on-equity but more modest growth profiles typical of Berkshire’s core holdings. Berkshire’s own size became a constraint; deploying tens of billions of dollars to move the needle requires investments in only the largest companies, limiting the pool of available opportunities.
Furthermore, the market’s prolonged premium on growth and technological disruption presented a challenge to Berkshire’s value-oriented bias. The "owner-operator" model, optimized for businesses with durable competitive moats and predictable cash flows, was less aligned with a market rewarding rapid scalability and future potential over present earnings.
Conclusion: The Enduring Model and the Evolving Test
The analysis indicates that Berkshire Hathaway’s six-decade outperformance was less a product of mere stock picking and more the result of building a superior financial machine for long-term compounding. The structural advantages of permanent, low-cost capital and asymmetric risk-taking created a unique compounding engine.The recent decade does not invalidate this model but highlights its contextual dependencies. It performed optimally in a market where size was not a paralyzing disadvantage and where value-oriented, cash-generative businesses could consistently outperform. The current paradigm, characterized by technological hyper-growth and market concentration, presents a different set of challenges.
The neutral prediction for the market and industry is a continued coexistence of both models under heightened scrutiny. The S&P 500’s recent strength validates the power of market concentration and technological adoption. Berkshire Hathaway’s model will be tested on its ability to adapt its capital allocation to a changed landscape, potentially through larger strategic acquisitions or shifts in sector weighting, while maintaining the core structural and behavioral disciplines that built its historic record. The performance duel remains a live experiment in financial architecture.
Trade Metrics
Related Datasets
Q4 Cross-Border Logistics Report
PDF • 4.2 MB
Automotive Parts Supply Chain Index
CSV • 1.1 MB