Beyond the Numbers: The Strategic Shifts Revealed by 2026 GDP Growth Forecasts

David Thompson
Data Editor
April 21, 2026
DATELINE: NA TRADE WIRE
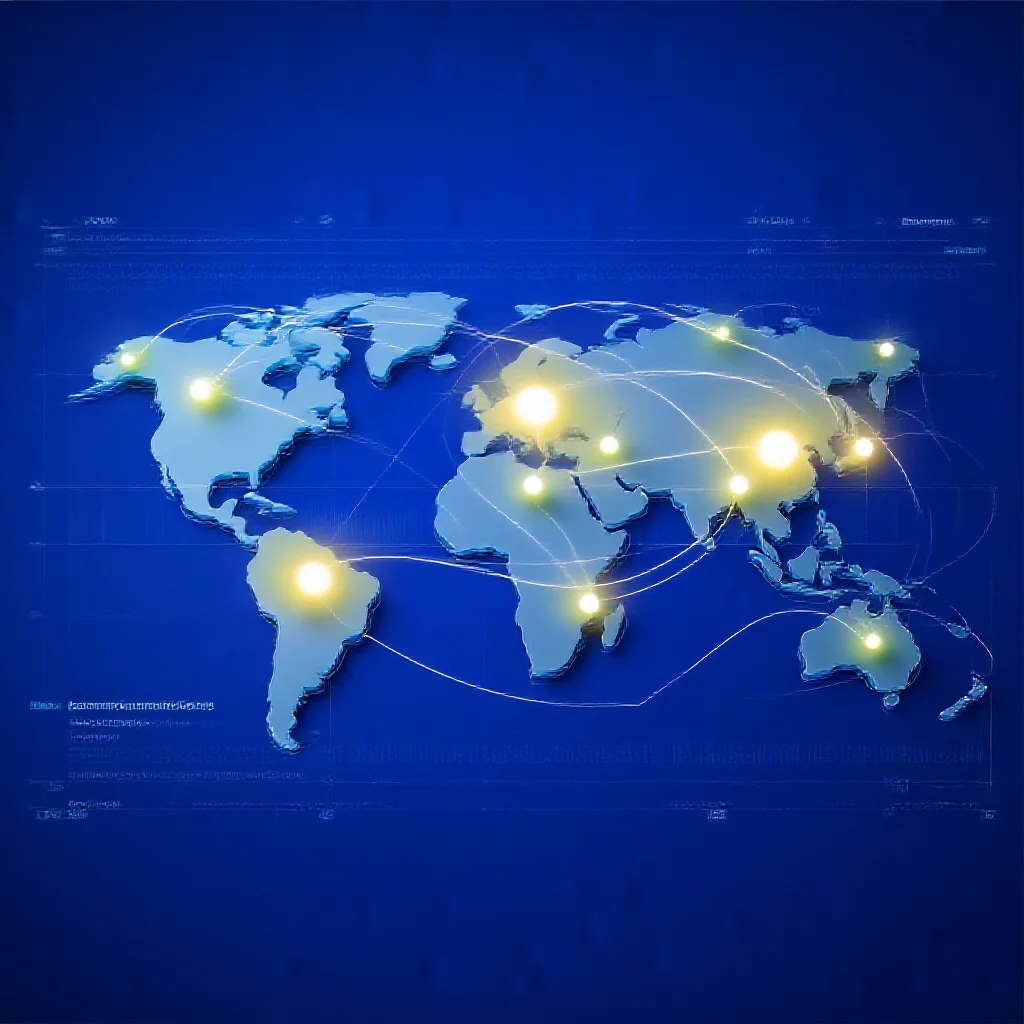
"The IMF's 2026 GDP growth forecasts for the world's 20 largest economies"
Beyond the Numbers: The Strategic Shifts Revealed by 2026 GDP Growth Forecasts
Introduction: The 2026 Forecast as a Strategic Compass
The International Monetary Fund’s (IMF) World Economic Outlook, published in April 2024, provides a detailed projection of Gross Domestic Product (GDP) growth for the world’s 20 largest economies in 2026 (Source 1: [Primary Data]). This dataset functions as a critical planning document for global stakeholders, extending beyond a simple ranking of economic speed. The dispersion of growth rates from approximately 1.5% to over 6% reveals more about underlying structural strengths, vulnerabilities, and strategic transitions than about near-term performance. The analysis posits that these forecasts serve as proxies for the foundational drivers of long-term economic health, including demographic trajectories, technological adoption curves, and energy transition investments.
Decoding the Divergence: Clusters of Growth Tell a Deeper Story
A granular examination of the 2026 forecasts indicates distinct clusters rather than 20 discrete data points. The first cluster comprises mature, advanced economies, predominantly in North America and Western Europe, with projected growth tightly grouped between 1.5% and 2.2%. The common threads here include aging demographics, high per-capita income bases that limit catch-up potential, and significant existing debt burdens.
The second, high-growth cluster is led by major emerging economies in Asia, with forecasts ranging from 5.0% to 6.5%. The drivers within this cluster are a combination of demographic dividends, rapid technological adoption, and sustained capital investment in infrastructure and manufacturing. A third, more variable cluster includes commodity-exporting nations, where growth projections are closely tied to volatile resource prices and investment cycles in energy transition materials.
This clustering demonstrates that the nominal “speed” of growth is a less critical metric than the implied “quality” and “sustainability” of its drivers. Economies forecast for higher growth in 2026 are typically those with structural momentum from younger populations and accelerating productivity, whereas lower-growth forecasts often reflect economic maturity and structural headwinds.
The Long-Term Impact: Reshaping Global Supply Chains and Capital Allocation
The 2026 growth expectations are not merely predictions but active inputs into current corporate and financial decision-making. Multinational corporations are using such mid-term forecasts to guide investments in supply chain resilience and market access, gradually reallocating manufacturing capacity and logistical networks toward higher-growth regions. This is evidenced by increased foreign direct investment flows into Southeast Asia and parts of South Asia, aligning with their superior growth outlooks.
Furthermore, the forecast acts as a snapshot of a broader, multi-year reallocation of global capital. The race for dominance in key technologies—such as artificial intelligence, semiconductors, and green technologies—is disproportionately funded by and directed toward economies with strong growth trajectories and large domestic markets. Concurrently, the energy transition is directing capital toward economies rich in critical minerals, influencing their 2026 growth projections through investment-led expansion. The forecast thus captures an ongoing shift in global economic mass and industrial capability.
Verification and Context: Understanding the IMF’s Model and Its Limitations
The core data for this analysis originates from the IMF’s World Economic Outlook model, a standardized framework incorporating variables such as fiscal policy, commodity prices, labor force growth, and productivity trends (Source 1: [Primary Data]). Standard caveats regarding forecasting uncertainty apply, particularly for a horizon two years into the future. These models inherently struggle to weight low-probability, high-impact “black swan” events, the disruptive pace of technological change like generative AI, and acute, non-linear impacts from climate change.
Cross-validation with other long-term institutional forecasts from the OECD and World Bank reveals a broad consensus on the clustering pattern and rank order of economies, lending robustness to the observed divergence. The primary variance lies in the precise magnitude of growth rates, not in the identification of high-growth and low-growth cohorts. This consensus underscores that the identified trends are structural rather than cyclical.
Conclusion: 2026 as an Inflection Point, Not Just a Destination
The IMF’s 2026 GDP growth forecasts synthesize to form a leading indicator of global economic rebalancing. They highlight an economy’s preparedness for the next decade’s challenges more than its performance in a single year. For investors, the dispersion maps the future path of capital returns and market expansion. For policymakers, it underscores the imperative of structural reforms in education, innovation, and infrastructure to improve long-term growth potential.
The neutral market prediction derived from this analysis is a continued, gradual reconfiguration of global supply chains toward emerging high-growth clusters, accompanied by sustained capital flows into sectors and regions aligned with technological leadership and energy transition. The 2026 forecast, therefore, is less a definitive destination and more a measurable inflection point in a prolonged shift in global economic power and connectivity.
Trade Metrics
Related Datasets
Q4 Cross-Border Logistics Report
PDF • 4.2 MB
Automotive Parts Supply Chain Index
CSV • 1.1 MB