Beyond Tesla''s Lead: The 2023 BEV Market Share Battle Reveals a New Global

David Thompson
Data Editor
April 8, 2026
DATELINE: NA TRADE WIRE
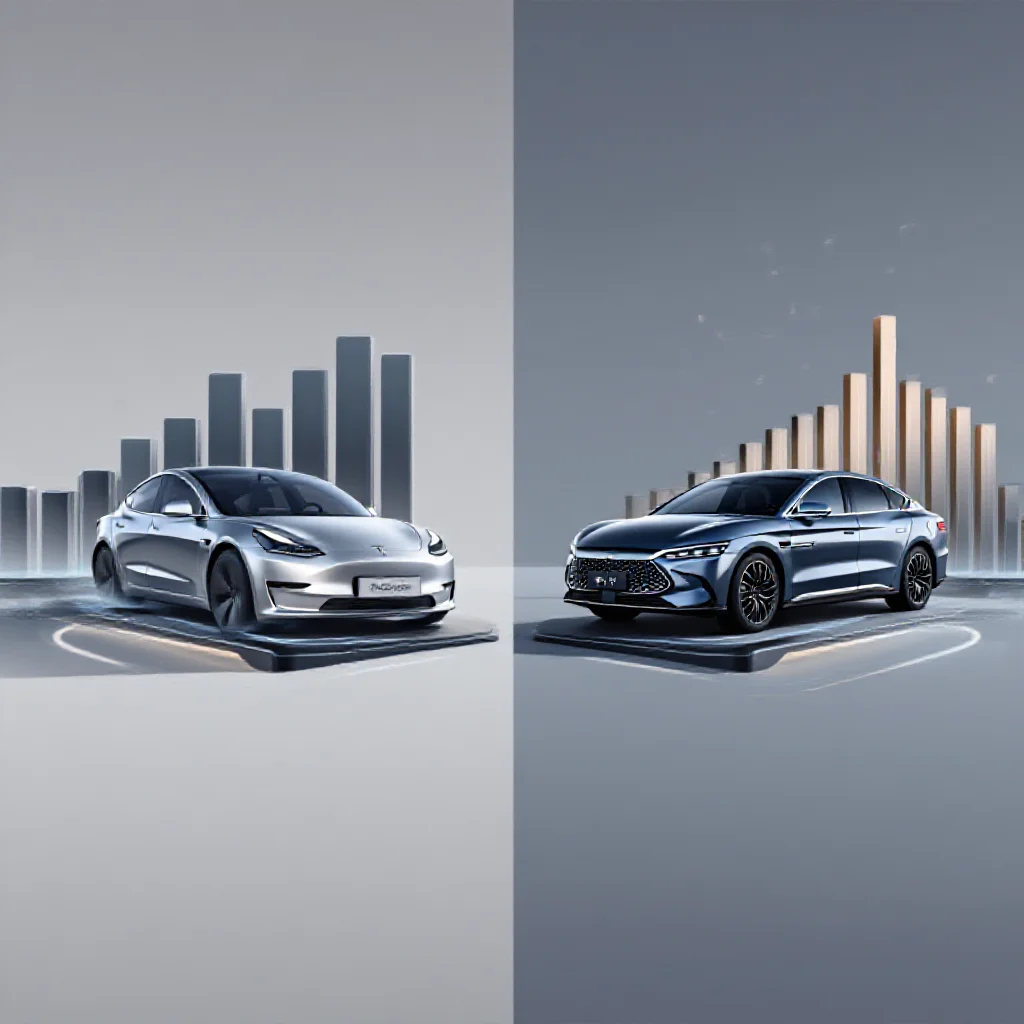
"While Tesla''s 19.5% share confirms its dominance, the 2023 global BEV market"
Beyond Tesla's Lead: The 2023 BEV Market Share Battle Reveals a New Global Order
The 2023 global battery electric vehicle (BEV) market share rankings provide a definitive snapshot of an industry undergoing a structural realignment. The headline figure confirms Tesla Inc.'s continued dominance with a 19.5% share of global BEV sales (Source 1: [Primary Data]). However, a more significant narrative emerges from the aggregation of market positions. The collective force of Chinese automakers—BYD (16.5%), SAIC Motor (8.5%), and Geely-Volvo (5.8%)—commands over 30% of the global market (Source 1: [Primary Data]). Volkswagen Group, with a 7.3% share, stands as the sole non-Chinese legacy automaker in the top five (Source 1: [Primary Data]). This distribution establishes a clear East-West competitive axis. Furthermore, the concentration of power is intensifying; the top 10 manufacturers accounted for nearly 70% of all BEVs sold in 2023, signaling a decisive move from a fragmented early-adopter phase toward a consolidated scaling phase (Source 1: [Primary Data]).
The 2023 Scorecard: More Than a Top-Five List
The ranking of individual manufacturers is less instructive than the analysis of competitive blocs and concentration ratios. Tesla's 19.5% share underscores its successful first-mover scaling and brand capitalization. The more consequential development is the formation of a Chinese bloc. BYD's 16.5% share, closely trailing Tesla, represents a vertically integrated powerhouse. SAIC's 8.5% share is heavily bolstered by its SAIC-GM-Wuling joint venture, a volume leader in ultra-affordable micro-EVs. Geely-Volvo's 5.8% reflects a dual-strategy of leveraging Geely's domestic scale and Volvo's premium global platform.
Volkswagen Group's position as the highest-ranked legacy automaker from outside China, at 7.3%, highlights both the scale of its transition effort and the challenges it faces. Its share is a function of significant investment in dedicated BEV platforms, yet it operates within a fundamentally different—and often more costly—industrial and supply chain framework than its top Chinese competitors.
The Hidden Axis: Regional Markets as Strategic Fortresses
Global market share percentages can obscure critical regional dependencies. The market positions of BYD, SAIC, and Geely are fundamentally anchored in the scale of the Chinese domestic market, the world's largest for BEVs. This provides a vast, protected volume base for scaling production and refining technology before international expansion.
In contrast, Tesla and Volkswagen's shares are built on diversified but intensely competitive international footprints across North America, Europe, and China. This global reach is a strength for brand and revenue stability but also a vulnerability, exposing them to regional regulatory shifts, trade policies, and localized competition. The SAIC-GM-Wuling phenomenon exemplifies a regional strategy; its micro-EVs dominate the low-end segment in China, contributing significantly to SAIC's volume but operating on a distinct, thin-margin business model separate from the premium BEV race.
Supply Chain as the Unseen Battleground
Market share in the BEV sector is increasingly a function of supply chain control, particularly over the battery and power electronics. BYD's strategy of deep vertical integration, encompassing in-house production of batteries, semiconductors, and numerous components, provides a structural cost advantage and supply security. This control directly translates into pricing power and margin resilience.
Most Western legacy automakers, including Volkswagen, rely on a procurement model, sourcing batteries and critical components through contracts with third-party suppliers like CATL, LG Energy Solution, or Samsung SDI. This creates cost volatility and exposes them to raw material price fluctuations. The competitive battleground is shifting from vehicle assembly to mastery of the battery value chain. Future market share positions for 2025-2030 will be partially determined by current investments in next-generation battery technologies, such as sodium-ion or solid-state chemistries, which promise further cost reductions or performance leaps.
!Supply Chain Diagram versus the more modular supply chain of a legacy automaker like Volkswagen.)
Inflection Point: Consolidation and the Coming Shakeout
The fact that the top 10 firms control nearly 70% of the market indicates the end of the initial exploratory phase. The industry is entering a period of capital-intensive scaling and inevitable consolidation. This environment creates a precarious position for automakers in the 6th to 15th rank, such as Hyundai-Kia (4.8%), Stellantis, and the Renault-Nissan-Mitsubishi Alliance. These firms possess the engineering capability and global presence to compete but must achieve sufficient BEV volume to justify standalone platform investments and secure competitive battery supply.
The logical trajectory points toward increased mergers, acquisitions, and strategic partnerships. Larger entities will seek to acquire market share, proprietary technology, or regional market access. Smaller, capital-constrained pure-play EV startups or legacy automakers struggling with the transition may become acquisition targets. The market structure is funneling toward a smaller number of vertically integrated giants and strategic alliances capable of competing on cost, technology, and global scale.
!Consolidation Funnel funneling down to significantly fewer, larger logos at the narrow bottom (projected 2030).)
Conclusion: The New Competitive Geography
The 2023 market share data crystallizes the new competitive geography of the automotive industry. The axis of competition is no longer solely between traditional OEMs and a disruptive newcomer. It is now defined by a tripartite struggle: the integrated Chinese bloc, the scaling pure-play leader (Tesla), and the transitioning legacy giants, of which Volkswagen is currently the most successful. The high market concentration indicates that competitive advantages are becoming structural and harder to overcome. Future shifts in ranking will likely result from strategic execution in supply chain mastery, technological innovation in batteries and software, and the ability to profitably serve not just premium but also volume segments across key global regions. The race for share is now a race for sustainable industrial architecture.
Trade Metrics
Related Datasets
Q4 Cross-Border Logistics Report
PDF • 4.2 MB
Automotive Parts Supply Chain Index
CSV • 1.1 MB