The 2022 Global Energy Map: How Fossil Fuels Still Rule and What It Means

David Thompson
Data Editor
March 22, 2026
DATELINE: NA TRADE WIRE
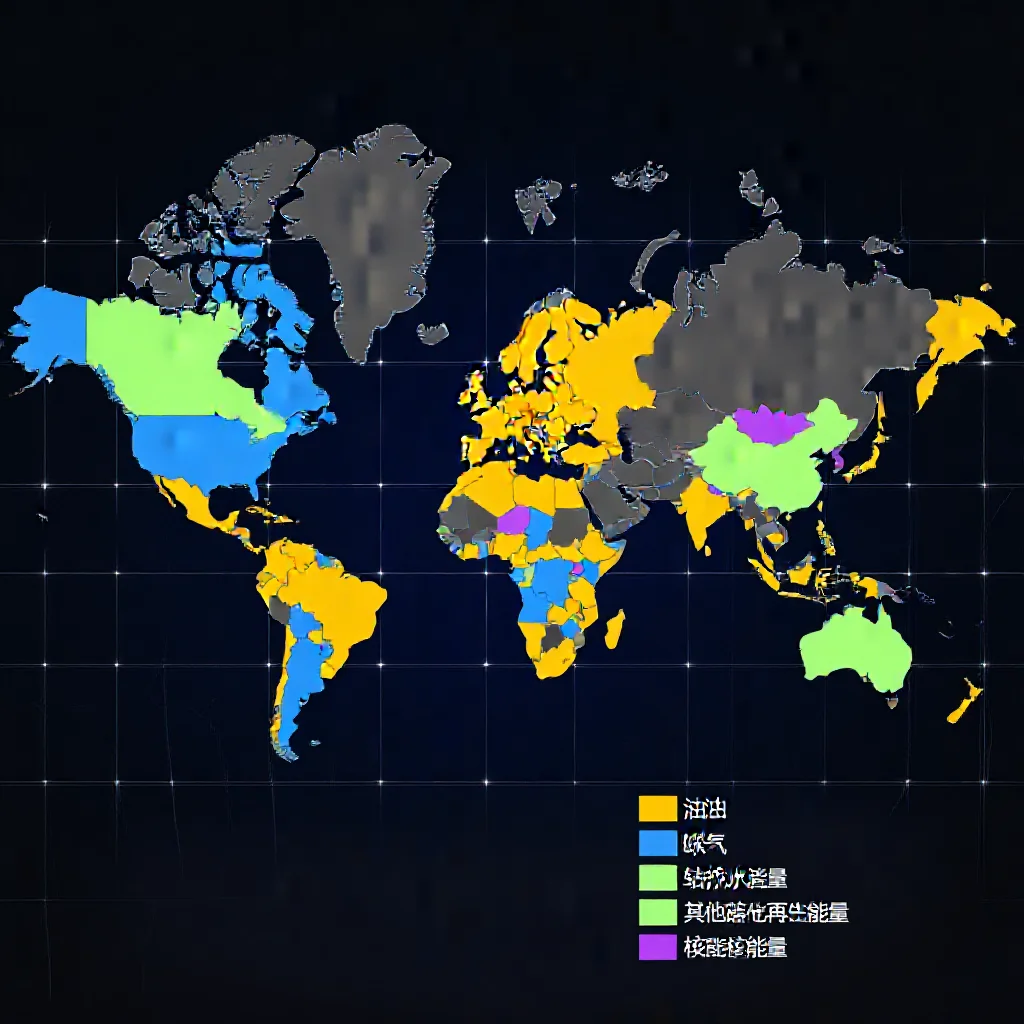
"An analysis of the 2022 global energy landscape, based on the Energy Institute's"
The 2022 Global Energy Map: How Fossil Fuels Still Rule and What It Means for the Energy Transition
Introduction: The Snapshot of a World in Transition (or Not)
The 2023 Statistical Review of World Energy, published by the Energy Institute, provides a definitive benchmark for global energy consumption. Analysis of its data for 2022 reveals a global landscape overwhelmingly shaped by fossil fuels. In that year, oil was the largest source of primary energy consumption in 95 countries, natural gas in 45, and coal in 32 (Source 1: [Primary Data]). Combined, these three fossil fuels constituted the primary energy source in 172 of the world’s 193 nations. Hydropower led in 11 countries, other renewables such as wind and solar in 8, and nuclear power in only 2. This distribution presents a central analytical question: does this map indicate incremental progress within a complex system, or does it signal profound structural inertia that defines the pace of the energy transition?
The Hidden Logic: Economic Development, Resource Endowment, and Path Dependence
The geographic distribution of dominant energy sources is not random; it follows a discernible logic of economics, geography, and historical investment. A strong correlation exists between a country's economic structure and its primary energy source. Oil dominance is prevalent not only in major producers in the Middle East and Africa but also in many developing and developed economies where transportation and petrochemical sectors are central. Natural gas leads in nations with substantial domestic reserves, such as Russia and Iran, and in economies that have made a strategic pivot from coal to gas. Coal remains primary in several Asian and Eastern European economies where heavy industry and legacy power generation infrastructure are entrenched.
This map illustrates two powerful, often interlocking, concepts: resource endowment and path dependence. Nations with abundant fossil fuel reserves are economically incentivized to utilize them, creating a "resource curse" for diversification. More universally significant is path dependence. The dominance of a particular energy source is reinforced by decades of investment in extraction, refining, distribution, and consumption infrastructure. This creates immense economic and technological inertia, locking nations into energy pathways that are resistant to rapid change, regardless of policy ambitions.
!World map highlighting regional clusters of dominant energy sources
The Elite Club of Low-Carbon Leaders: Lessons from France, Slovakia, and the Renewable Vanguard
Only 21 countries had a non-fossil source as their largest form of primary energy consumption in 2022. The two nuclear leaders, France and Slovakia, represent exceptional cases driven by sustained, state-led energy policy decisions made decades ago, focused on energy security and independence. Their current status is a legacy of long-term capital investment and technological standardization, highlighting that a nuclear-led profile requires political consensus and planning horizons spanning generations.
The 19 countries led by hydropower or other renewables are typically characterized by specific geographic advantages or early-adopter policies. Nations like Norway, Paraguay, and Iceland possess exceptional hydropower or geothermal resources. Countries where wind, solar, and other renewables lead, such as Denmark, demonstrate the outcome of consistent regulatory frameworks and integration into regional power grids. These nations enjoy a significant head start in decarbonization and, in many cases, enhanced energy security. However, their profiles are often less replicable at scale for larger, more industrially complex economies without similar natural endowments.
!Focused map inset highlighting France, Slovakia, and countries where hydro/renewables are primary
A Reality Check for the Energy Transition: What the 2022 Map Truly Reveals
The 2022 data serves as a "slow analysis" benchmark, exposing deep systemic challenges rather than merely documenting annual fluctuations. It underscores that the global energy transition is a process of system replacement, not merely fuel substitution. The overwhelming fossil fuel dominance indicates that global infrastructure, trade routes, financial systems, and geopolitical relationships remain overwhelmingly configured for hydrocarbons.
A critical analytical note involves the "primary energy" metric itself. The method of counting primary energy, which accounts for the total energy content of fuels, inherently over-represents fossil fuels due to the significant waste heat in thermal power generation. Renewable sources like wind and solar convert primary energy (wind, sunlight) to electricity more directly. While this statistical nuance is important, it does not negate the fundamental reality of dependency the map reveals. The global economy's engine room still runs predominantly on combusted hydrocarbons.
Conclusion: Decoding the Map's Signal for Markets and Policy
The 2022 global energy map provides a sobering baseline for measuring future progress. Its primary signal is one of entrenched systems. For market analysts, it confirms that near- to medium-term energy commodity demand will remain structurally robust, underpinned by the sheer scale of existing infrastructure. Investment in fossil fuel supply chains will continue to be necessary to maintain system stability even as capital flows accelerate toward alternatives.
For the energy transition, the map defines the magnitude of the challenge. Progress will be measured not by the number of new renewable projects announced, but by the gradual reduction in the count of fossil-fuel-dominated nations over coming decades. The transition will be nonlinear and geographically uneven, marked by regional shifts in the map's color palette as path dependence is slowly overcome by economic tipping points, technological innovation, and long-term policy commitment. The 2022 snapshot is a reminder that global energy systems evolve with geological, not digital, time scales.
Trade Metrics
Related Datasets
Q4 Cross-Border Logistics Report
PDF • 4.2 MB
Automotive Parts Supply Chain Index
CSV • 1.1 MB