Beyond the Headline Numbers: Decoding the Rail Industry''s Mixed Recovery

Emily Rodriguez
Cross-Border Trade Reporter
March 29, 2026
DATELINE: NA TRADE WIRE
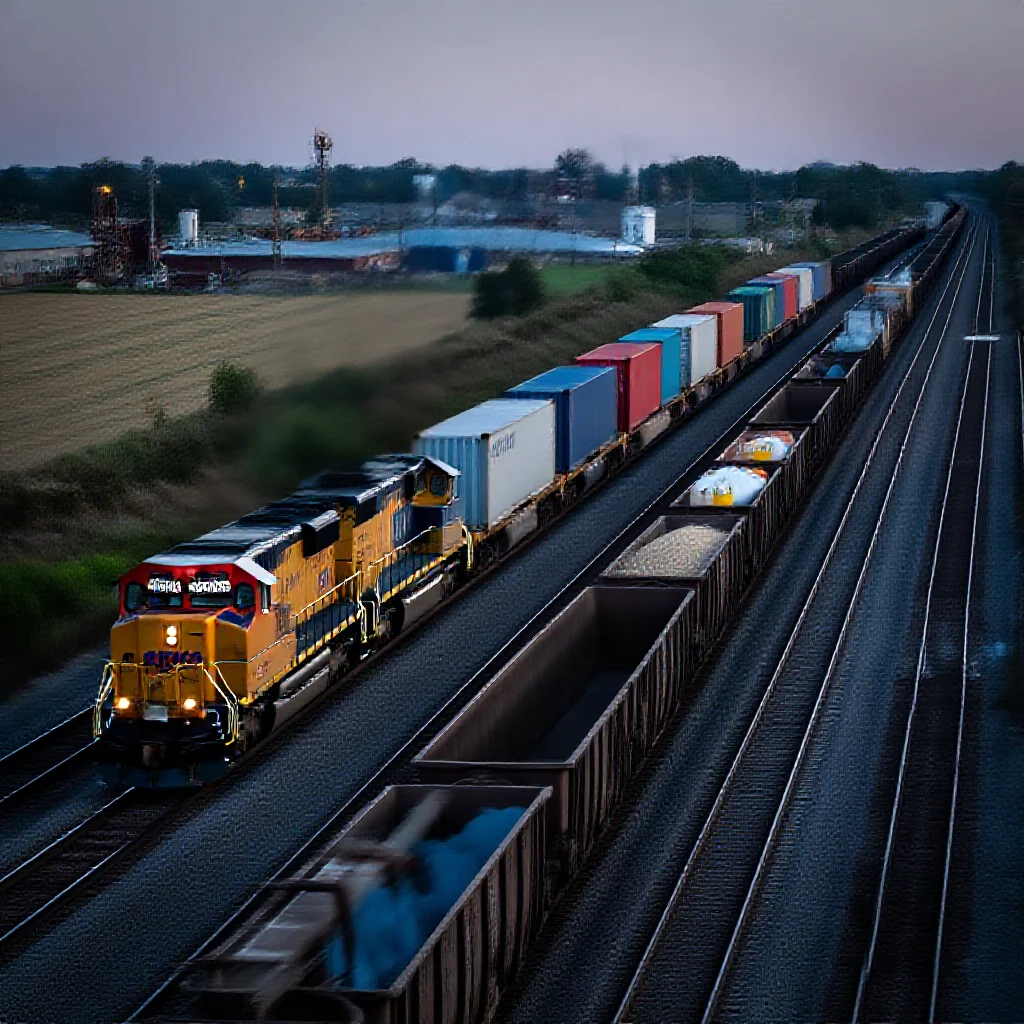
"While the Association of American Railroads (AAR) signals an improved economic"
Beyond the Headline Numbers: Decoding the Rail Industry's Mixed Recovery Signals
The Duality of Recovery: AAR's Optimism Meets Mixed Traffic Data
The Association of American Railroads (AAR) has signaled an improved economic outlook for the rail sector. This optimism, however, is immediately challenged by a granular examination of the most recent traffic data. For the week ending April 20, 2024, total combined U.S. rail traffic—encompassing both carloads and intermodal units—registered at 843,037, a decline of 0.4% compared with the same week last year (Source 1: [Primary Data]). The year-to-date picture is more pronounced, with total traffic for the first 16 weeks of 2024 down 3.6% from the comparable 2023 period (Source 1: [Primary Data]).
The critical analytical axis for understanding this divergence lies in the bifurcation of the data stream. U.S. rail carloads for the cited week totaled 428,870, marking a 1.3% year-over-year increase. Conversely, U.S. rail intermodal volume, at 414,167 units, fell by 2.1% (Source 1: [Primary Data]). This fundamental split between rising bulk commodity movement and falling container traffic forms the core narrative of the industry's current, complex recovery phase.
Deep Dive: The Commodity Story Behind the Carload Gain
The 1.3% gain in weekly carloads is not a broad-based lift but a story of selective strength. Nine of the ten carload commodity groups posted increases compared with the same week in 2023 (Source 1: [Primary Data]). The leadership cohort—chemicals, farm products, and nonmetallic minerals—points toward resilience in industrial and agricultural production. Chemical carloads suggest sustained activity in manufacturing and energy sectors, while farm products reflect ongoing domestic and, potentially, export demand for food and feed. Nonmetallic minerals, often used in construction, may indicate stability in infrastructure and industrial building projects.
The sole commodity group in decline was grain (Source 1: [Primary Data]). This outlier status warrants investigation into factors distinct from the broader industrial recovery. Potential causes include specific harvest cycle timing, competitive pressure from other transport modes for domestic movement, or fluctuations in key export markets that have not yet aligned with current shipping patterns. The grain sector's weakness, isolated amidst widespread carload gains, underscores the sector-specific variables that persist beneath aggregate figures.
The Intermodal Conundrum: A Bellwether for Consumer Demand?
The sustained 2.1% weekly decline in intermodal volume presents a more concerning signal. Intermodal traffic, which primarily involves the movement of shipping containers and truck trailers, is a direct conduit for consumer goods, linking port terminals to inland distribution networks. Its persistent weakness suggests softer demand for imported retail goods and ongoing adjustments in retail and wholesale inventory levels.
This trend may indicate a broader supply chain recalibration. Following the inventory surge of previous years, a shift toward leaner stockpiles reduces the need for high-volume containerized imports. Furthermore, this data aligns with observable trends in reduced port congestion and normalized ocean freight rates. The question for the rail sector is whether this represents a temporary inventory correction or a longer-term reduction in the reliance on long-haul, port-to-inland rail intermodal service, particularly if nearshoring or regionalization of supply chains gains momentum.
The Bigger Picture: What the 2024 Year-to-Date Trend (-3.6%) Really Means
The 3.6% cumulative decline over the first 16 weeks of 2024 contextualizes the weekly data, moving analysis beyond short-term volatility (Source 1: [Primary Data]). This is not merely a post-pandemic normalization but potentially a structural recalibration of freight flows. The evidence suggests a market where rail is experiencing a shift in its freight mix: gaining modest traction in industrial and agricultural bulk commodities while ceding volume in the consumer-driven intermodal segment.
The trajectory of the AAR's "improved outlook" will be determined by which of these forces proves dominant. A scenario where industrial production and capital investment accelerate could solidify the carload recovery, offsetting intermodal softness and leading to a more balanced, commodity-driven growth path for the industry. Alternatively, a prolonged slump in consumer goods demand, coupled with competitive inroads from other transport modes, could pressure the intermodal segment further, constraining overall rail volume growth despite strength in specific bulk sectors. The current data depicts an industry at an inflection point, its performance increasingly dictated by the underlying balance between industrial production and consumer spending within the broader economy.
Trade Metrics
Related Datasets
Q4 Cross-Border Logistics Report
PDF • 4.2 MB
Automotive Parts Supply Chain Index
CSV • 1.1 MB