Beyond the Fuel Spike: Why J.B. Hunt''s Intermodal Boom Isn''t a Simple Truckload

Emily Rodriguez
Cross-Border Trade Reporter
March 29, 2026
DATELINE: NA TRADE WIRE
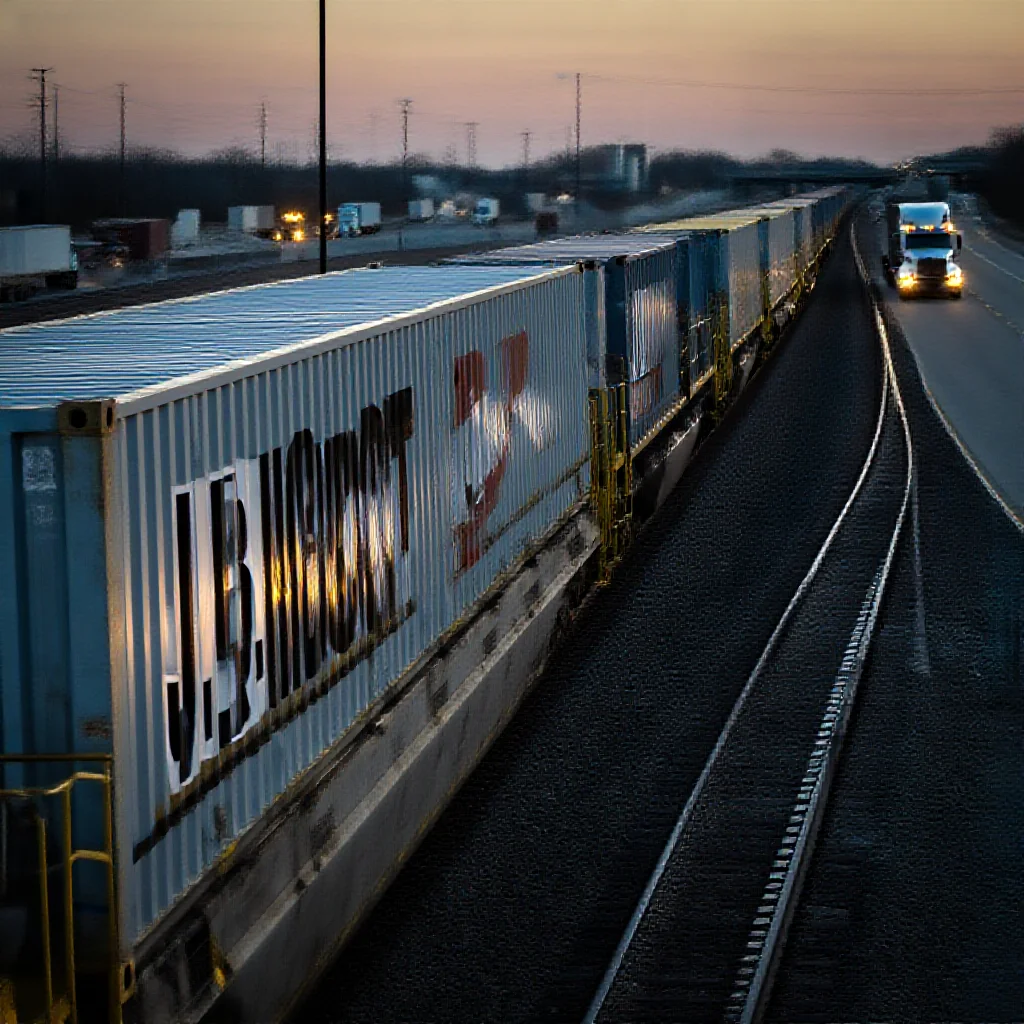
"J.B. Hunt's Q1 2022 results show surging intermodal revenue and volume, yet"
Beyond the Fuel Spike: Why J.B. Hunt's Intermodal Boom Isn't a Simple Truckload Conversion Story
The Paradox: Surging Intermodal Amidst a 'Non-Event' Fuel Spike
J.B. Hunt Transport Services Inc. reported first-quarter 2022 results that presented a compelling market paradox. The company’s intermodal segment, which moves freight using a combination of rail and truck, posted a 31% year-over-year revenue increase to $1.8 billion. Operating income for the segment surged 64% to $177.3 million (Source 1: [Primary Data]). This robust performance coincided with a period of significantly elevated diesel prices, a condition historically linked to shippers converting freight from truckload to intermodal to manage costs.
However, J.B. Hunt’s leadership explicitly rejected this traditional narrative. CEO John Roberts stated, "We have not seen a significant conversion from truckload to intermodal as a result of the recent fuel spike" (Source 1: [Primary Data]). This declaration creates a central analytical puzzle: what is driving record intermodal growth if not the obvious macroeconomic trigger? The answer lies in a deeper examination of structural demand and capacity constraints, revealing a more complex freight market dynamic.
Decoding the Demand Engine: What's Really Fueling Intermodal Growth?
The growth metrics indicate a foundation of persistent, structural demand rather than a reactive, fuel-driven shift. Intermodal volume grew 9% year-over-year in Q1 2022, with the average load count rising 4% sequentially from the already-strong fourth quarter of 2021 (Source 1: [Primary Data]). This sequential increase suggests momentum built on factors beyond a transient fuel price shock.
Analysis points to two primary demand drivers. First, prolonged supply chain congestion and extreme volatility in the spot truckload market have compelled shippers to seek reliable, contracted capacity. Intermodal, with its scheduled rail service, offers a predictable alternative. Second, this trend is corroborated by performance across J.B. Hunt’s other service lines. Dedicated Contract Services revenue grew 26% year-over-year to $716 million (Source 1: [Primary Data]), demonstrating a company-wide pattern of shippers securing long-term, committed capacity solutions over short-term transactional arrangements. The intermodal growth is part of a broader strategic shift toward supply chain resilience and away from exposure to spot market volatility.
The Capacity Constraint: The Invisible Handcuff on Modal Shift
A critical, and often overlooked, factor capping the potential for a fuel-driven modal shift is internal capacity limitation. During the first quarter, J.B. Hunt’s intermodal network operated at approximately 90% of its desired operating capacity (Source 1: [Primary Data]). This figure is not an indicator of underperformance but a confession of a growth ceiling. The network was functionally full relative to its current resource envelope.
President of Intermodal Darren Field’s comment that "We are still operating at a level that is below what we would like to operate at from a capacity perspective" (Source 1: [Primary Data]) underscores this constraint. The company ended the quarter with approximately 109,000 pieces of trailing equipment (Source 1: [Primary Data]). The analysis suggests that even if a wave of truckload conversion demand materialized, J.B. Hunt’s ability to capture it would be immediately limited by the availability of containers, chassis, and network fluidity. The primary growth barrier is internal asset utilization and network design, not a lack of external demand stimulus.
Truckload's Resilience and the Fragmented Conversion Thesis
The resilience of the truckload market further complicates the simple conversion thesis. J.B. Hunt’s own truckload segment reported a 15% year-over-year revenue increase to $271 million in Q1 2022 (Source 1: [Primary Data]). While its operating income declined to $15.5 million from $21.5 million a year prior—indicating severe cost pressure from fuel, labor, and equipment—the segment retained volume.
This resilience indicates that the decision calculus for shippers has evolved. Modal selection is no longer a straightforward function of fuel cost arbitrage. Factors such as transit time, reliability, shipment size, origin-destination lane density, and the need for flexibility now play equally critical roles. For many freight movements, particularly those requiring speed or moving outside dense intermodal corridors, truckload remains the only viable option regardless of fuel price. The market is not bifurcated but fragmented, with intermodal capturing a specific type of freight where its value proposition aligns, independent of short-term fuel fluctuations.
Strategic Implications and Future Market Trajectory
The Q1 2022 results from J.B. Hunt signal a maturation of the intermodal value proposition. Growth is increasingly decoupled from reactive fuel price cycles and is instead tied to strategic, long-term shipper decisions aimed at building resilient supply chains. The primary challenge for intermodal providers like J.B. Hunt and its rail partner, BNSF Railway, is scaling capacity and service consistency to meet this structural demand.
Future market trends will likely be governed by two competing forces. First, if sustained high diesel prices persist, they may eventually exert a stronger gravitational pull on price-sensitive, longer-haul freight that is currently on the margin of conversion. Second, and more significantly, the rate of intermodal growth will be constrained by the industry’s capital-intensive ability to add equipment, terminal capacity, and rail service precision. The ceiling for growth is set by operational execution and investment, not by the volatility of external fuel markets. The era where fuel price alone dictated modal share has given way to a more complex competition based on reliable capacity, network design, and integrated service offerings.
Trade Metrics
Related Datasets
Q4 Cross-Border Logistics Report
PDF • 4.2 MB
Automotive Parts Supply Chain Index
CSV • 1.1 MB