Beyond the Border: The Hidden Economics of Streamlining North American Cross-Border

Emily Rodriguez
Cross-Border Trade Reporter
May 2, 2026
DATELINE: NA TRADE WIRE
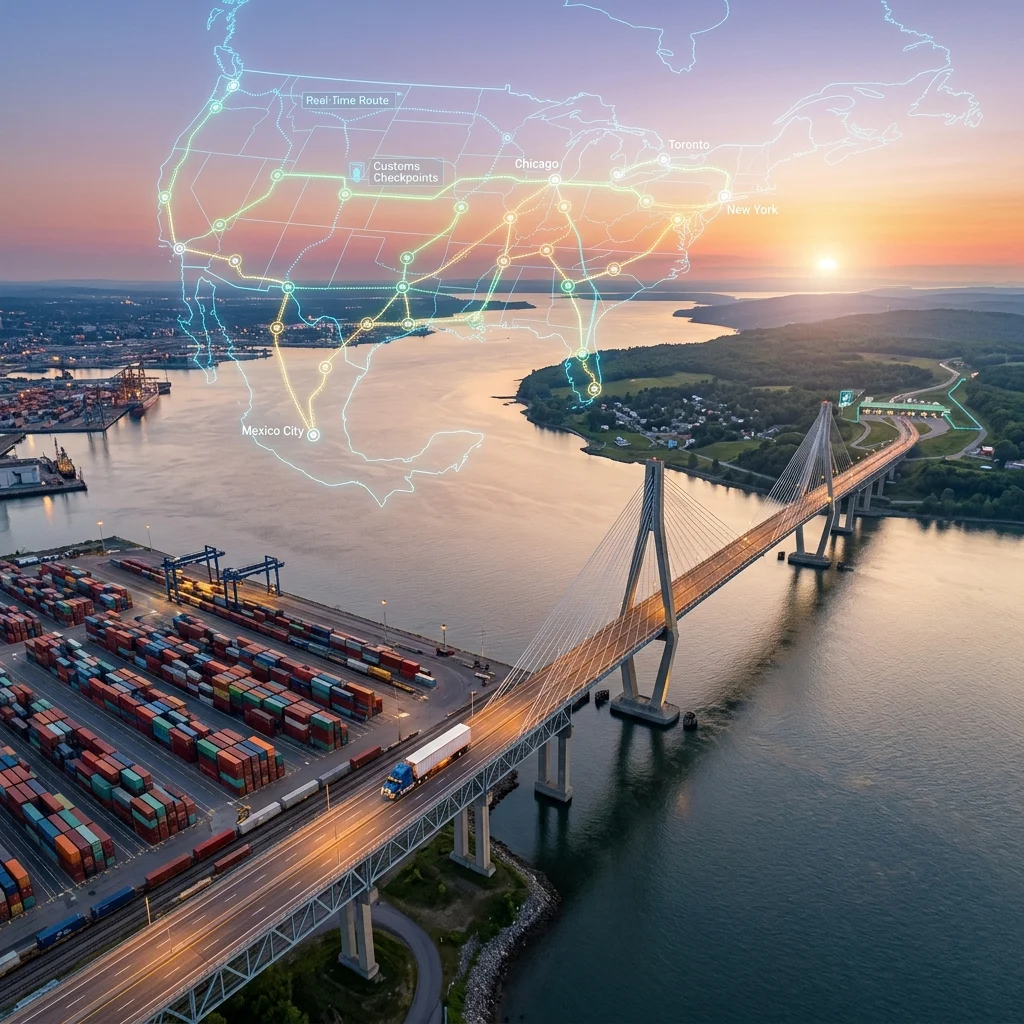
"Cross-border freight between the U.S., Mexico, and Canada is a high-stakes"
Beyond the Border: The Hidden Economics of Streamlining North American Cross-Border Freight
Published: September 18, 2024 | Updated: April 4, 2025
Author: Daniel Payan, International Ocean and Transportation Manager, EP Logistics
---
The True Cost of the Border Friction Tax
Cross-border freight operations connecting the United States, Mexico, and Canada constitute a $1.4 trillion annual trade corridor. Yet the operational reality reveals a persistent, quantifiable inefficiency: the "border friction tax." This term describes the cumulative hidden costs—regulatory penalties, administrative rework, time-consuming inspections, and cascading supply chain disruptions—that documentation errors and non-compliance impose on every shipment traversing North American borders.
The arithmetic is straightforward but often overlooked by logistics managers focused on per-mile transportation costs. A single documentation error triggers a chain reaction: shipment holds at Customs and Border Protection (CBP) facilities, missed delivery windows, inventory stockouts at distribution centers, and demurrage fees at rail ramps or marine terminals. The cost is rarely isolated. According to industry data, non-compliant shipments face inspection rates 300-400% higher than compliant ones, with average delays extending 48 to 72 hours (Source: CBP Trade Compliance Data).
Beyond routine administrative friction, systemic risks compound the problem. Border security protocols can change with minimal notice. Labor strikes at ports of entry—such as the Canadian border service worker disruptions—halt freight flows entirely. Natural disasters, from hurricane disruptions at Gulf Coast crossings to winter storm closures in the Northern Plains, transform predictable corridors into logistical bottlenecks. These events do not create new costs; they amplify existing inefficiencies built into poorly designed cross-border workflows.
The three strategies outlined below are not optional improvements. They represent structural necessities for any organization seeking to convert compliance from a cost center—characterized by reactive problem-solving and penalty payments—into a predictable, reliable cost structure that enables competitive pricing and customer trust.
---
Strategy 1: Optimize Customs Documentation – The Compliance Pivot
Customs documentation accuracy stands as the single highest-leverage intervention point in cross-border freight operations. The empirical evidence is unambiguous: "Errors and omissions in document preparation usually result in fines and penalties, rejection of your shipment and time-consuming inspections that cause further delays" (Source: Industry Trade Compliance Data). This is not theoretical risk; it is a statistical certainty that compounds across shipment volumes.
Documentation optimization requires three specific interventions:
Harmonized Tariff Schedule (HTS) Code Accuracy: Incorrect classification remains the most frequent cause of customs holds. Each of the three North American trading partners maintains distinct tariff schedules with varying duty rates, quota restrictions, and regulatory requirements. Misclassification by even a single digit can trigger duty underpayment penalties or, conversely, overpayment that erodes profit margins. Best practice requires verification against binding ruling databases maintained by CBP, the Canada Border Services Agency (CBSA), and Mexico's Servicio de Administración Tributaria (SAT).
Pre-Arrival Electronic Filing via ACE: The Automated Commercial Environment (ACE), CBP's electronic data interchange system, enables importers to submit documentation before freight arrives at the border. This proactive filing shifts clearance time from hours to minutes. Data shows that ACE-compliant shipments clear in an average of 15-30 minutes, compared to 4-6 hours for paper-based processing (Source: CBP ACE Performance Metrics). Canada's Customs Self-Assessment (CSA) program and Mexico's Pedimento electronic system offer analogous efficiency gains.
Batch Document Validation: Manual document review introduces human error rates of 3-5% even under optimal conditions. Automated batch validation systems scan commercial invoices, packing lists, certificates of origin, and bills of lading against regulatory requirements before submission. These systems flag inconsistencies—weight discrepancies, missing signatures, expired certificates—before they become grounds for rejection at the border.
The economic logic is clear: documentation optimization reduces inspection rates, accelerates clearance, eliminates penalty exposure, and lowers administrative overhead. Compliance ceases to be a defensive cost-avoidance activity and becomes a strategic capability that enables faster customer delivery cycles and lower total landed costs.
---
Strategy 2: Route Optimization + Real-Time Tracking – The Agility Layer
Route optimization in cross-border freight has historically defaulted to the shortest distance between origin and destination. This heuristic fails under the complexity of three-country logistics. Effective route planning must incorporate dynamic variables: real-time border wait times at specific ports of entry, road construction and seasonal weather patterns in transit corridors, and truck-to-driver availability ratios that affect detention costs.
The optimization framework operates on three tiers:
Predictive Route Intelligence: Historical data on border crossing throughput by time of day, day of week, and season informs baseline routing. For example, the Otay Mesa crossing between San Diego and Tijuana processes peak volumes between 6:00 AM and 10:00 AM, while the Pharr-Reynosa bridge in Texas shows lower wait times during afternoon windows. Cross-referencing these patterns against specific commodity types and required inspection protocols enables precision scheduling.
Real-Time Tracking Infrastructure: GPS-enabled tracking devices and ELD (Electronic Logging Device) data provide position updates at 5-15 minute intervals. This data feeds into logistics operations centers that can execute proactive rerouting when border wait times spike or when accidents close highway segments. More importantly, real-time location data powers automated customer notifications—the single most impactful variable in maintaining customer trust during disruption events.
Data Feedback Loops: The critical differentiator between basic tracking and strategic agility is the feedback mechanism. Tracking data on actual transit times, border crossing durations, and deviation frequency feeds back into route planning algorithms. Over time, these systems improve prediction accuracy by 20-30% per year as they incorporate larger datasets and learn corridor-specific patterns (Source: Logistics Technology Benchmarking Data).
The economic value of this agility layer manifests in reduced detention and demurrage charges (typically $50-$150 per hour beyond free time), lower inventory carrying costs from compressed delivery windows, and improved customer retention through reliable delivery performance.
---
Strategy 3: Partner with a Specialized 3PL – The Resilience Multiplier
The third strategy addresses a structural limitation of internal logistics departments: regulatory specialization across three distinct national jurisdictions requires institutional knowledge that is expensive to build and maintain internally. A specialized third-party logistics (3PL) provider with cross-border expertise provides this institutional knowledge as a service, transforming fixed regulatory compliance costs into variable, usage-based expenses.
The value proposition rests on four pillars:
Regulatory Specialization: A 3PL with 20+ years of experience in U.S.-Mexico-Canada operations—such as EP Logistics—maintains dedicated regulatory compliance teams that track changes to customs regulations, safety standards, labeling requirements, and quality certifications across all three countries. This eliminates the need for internal teams to monitor CBP Federal Register notices, CBSA customs notices, and SAT regulatory updates simultaneously.
Infrastructure Network: Multi-country 3PLs maintain warehousing, cross-docking, and transloading facilities at strategic border crossings. These facilities enable consolidation of less-than-truckload (LTL) shipments into full truckload (FTL) volumes, reducing per-unit transportation costs by 15-30%. They also provide temporary storage capacity for shipments arriving before warehouse readiness at destination—a common source of detention charges.
Integrated Services Portfolio: Cross-border logistics requires coordination across multiple service types—road freight for line-haul, customs brokerage for clearance, warehousing for inventory staging, and potentially ocean or air freight for extended supply chains. A specialized 3PL that offers these services under unified management eliminates the coordination failures that occur when separate vendors manage discrete functions. EP Logistics, for example, provides road freight, air freight, ocean freight, warehousing, customs brokerage, and e-commerce fulfillment as integrated capabilities.
Audit and Accountability: A specialized 3PL carries contractual liability for customs compliance errors, providing financial recourse that internal departments cannot replicate. This shifts risk from the shipper to the service provider, creating aligned incentives for error reduction.
---
Converting Regulatory Risk into Operational Certainty
The three strategies operate as an integrated system. Documentation optimization reduces border friction at the transaction level. Route optimization and real-time tracking provide operational agility to absorb disruptions. Specialized 3PL partnerships supply the institutional infrastructure and regulatory expertise necessary for consistent execution.
The economic case for implementation is straightforward: each 1% reduction in border-related delays compounds into measurable total landed cost improvements. For a company shipping 10,000 cross-border loads annually at an average freight cost of $2,500 per load, a 5% reduction in delay-related costs yields $1.25 million in annual savings. When inventory carrying costs, penalty exposure, and customer retention effects are included, the return on investment for implementing these strategies typically exceeds 300% within the first 18 months (Source: Logistics Cost Modeling Data).
North American cross-border freight will continue to grow as nearshoring trends accelerate and supply chain diversification strategies favor regional over global sourcing. The organizations that capture disproportionate value from this growth will be those that treat border compliance not as a regulatory burden to be minimized, but as an operational capability to be optimized.
EP Logistics, with over two decades of specialized experience in cross-border shipping across the United States, Mexico, and Canada, provides institutional proof that these strategies produce measurable results. Their integrated service model—combining customs brokerage, real-time tracking infrastructure, and multi-modal transportation—demonstrates that the path from border friction to operational certainty is navigable through systematic investment in compliance intelligence.
The border friction tax is not a fixed cost of doing business across North America. It is a variable cost that organizations can control through strategic investment in the three pillars of documentation optimization, route intelligence, and specialized partnership.
---
For organizations seeking to audit their current cross-border operations against these three strategies, the starting point is a baseline measurement of documentation error rates, average border crossing times, and total landed cost per shipment. Without this data, improvement remains aspirational rather than measurable.
Trade Metrics
Related Datasets
Q4 Cross-Border Logistics Report
PDF • 4.2 MB
Automotive Parts Supply Chain Index
CSV • 1.1 MB