The Q4 Divide: Why 3PL Marketing Spend Efficiency Signals a Structural Shift

Emily Rodriguez
Cross-Border Trade Reporter
April 24, 2026
DATELINE: NA TRADE WIRE
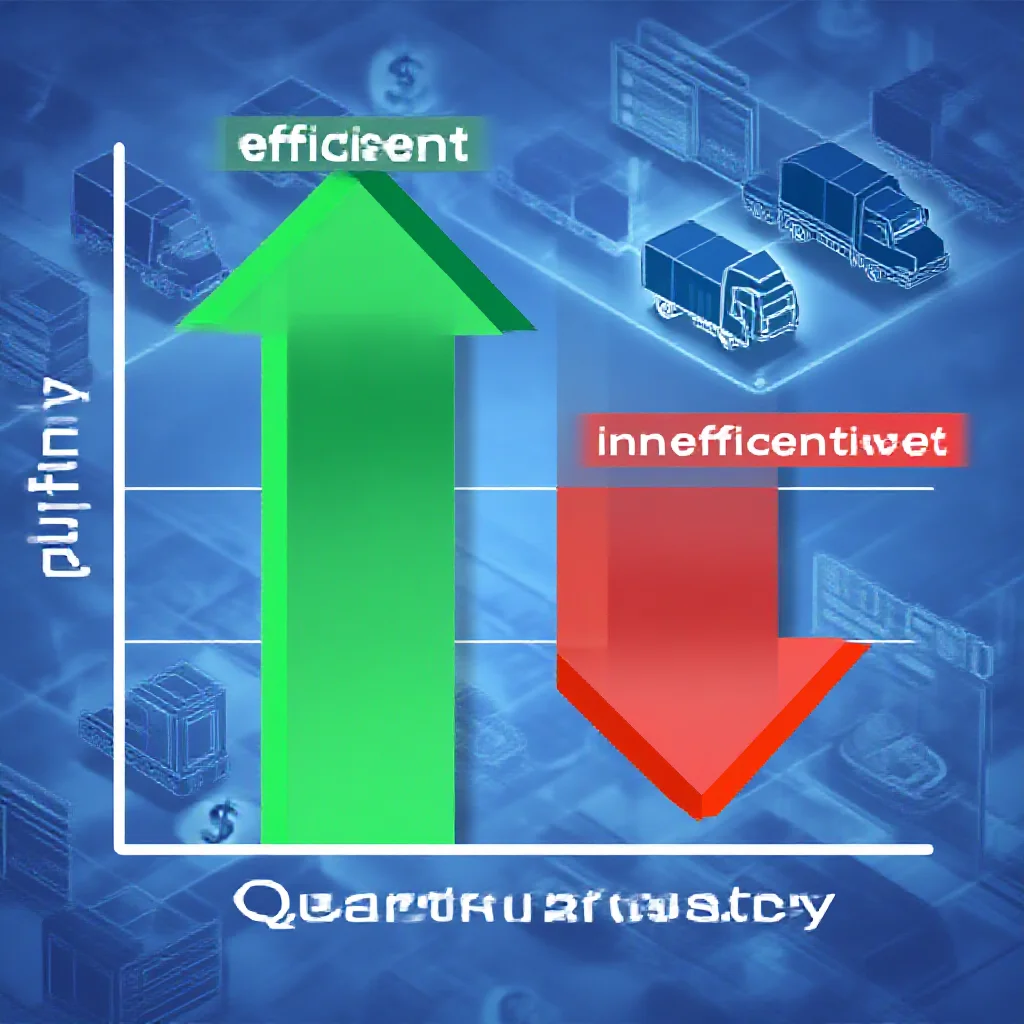
"In Q4, third-party logistics (3PL) providers experienced a dramatic divergence"
The Q4 Divide: Why 3PL Marketing Spend Efficiency Signals a Structural Shift in Logistics
Subtitle: LeadCoverage data reveals a widening chasm in marketing ROI among third-party logistics providers, pointing to fundamental changes in how logistics firms must compete for customers.
---
1. The Data Snapshot: What LeadCoverage Revealed
In the fourth quarter of the most recent fiscal year, third-party logistics providers exhibited a pronounced divergence in marketing spend efficiency, according to analysis from LeadCoverage, a recognized analytics platform specializing in logistics and supply chain sales intelligence (Source 1: Primary Data). Marketing spend efficiency—defined here as revenue generated per dollar of marketing expenditure, adjusted for cost per lead and conversion rate—varied by more than 40 percentage points between the top-quartile and bottom-quartile performers within the same peer group.
The data, drawn from aggregated platform activity across hundreds of 3PL firms, shows that while the industry median efficiency remained flat relative to Q3, the standard deviation of performance nearly doubled. This is not a statistical artifact of small sample sizes; the observation holds across sub-sectors including freight brokerage, warehousing, and integrated logistics.
LeadCoverage’s methodology tracks end-to-end attribution: from initial digital touchpoint through opportunity creation to closed revenue. This eliminates the distortion of vanity metrics—impressions or clicks without pipeline conversion—and provides a direct measure of whether marketing dollars are actually moving the revenue needle.
The key finding: approximately 30% of 3PLs achieved efficiency gains exceeding 15% quarter-over-quarter, while a comparable cohort saw declines of 20% or more. The middle 40% remained essentially static (Source 1: Primary Data).
---
2. The Hidden Axis: Efficiency as a Proxy for Digital Maturity
The divergence in marketing spend efficiency is not randomly distributed. Analysis of LeadCoverage’s accompanying firmographic data reveals a strong correlation between efficiency outcomes and the degree of digital sales infrastructure deployed.
Firms classified as “digitally mature”—those operating integrated CRM platforms, automated lead scoring, and multi-touch attribution models—consistently occupied the high-efficiency cluster. These organizations feed campaign performance data back into budget allocation decisions on weekly, sometimes daily, cycles. Conversely, firms reliant on trade show attendance, cold calling, and manual CRM entry populated the low-efficiency tail.
This pattern reflects the economic principle of marketing operating leverage. Digital marketing infrastructure involves fixed costs: platform subscriptions, data integration, attribution modeling. Once a threshold of spend is crossed—typically between $500,000 and $2 million annually in marketing budget, depending on firm size—these fixed investments begin generating disproportionately high returns per incremental dollar. The marginal cost of serving one additional qualified lead approaches zero.
Legacy 3PLs remain trapped below this inflection point. They allocate comparable total spend but fragment it across non-trackable channels, preventing the accumulation of the data corpus required for algorithmic optimization. The result is a self-reinforcing cycle: low efficiency prevents the budget reallocation needed to build the infrastructure that would generate higher efficiency.
---
3. Asset-Heavy vs. Asset-Light: Different Rules, Different Returns
The divergence pattern cannot be fully explained by digital maturity alone. A structural distinction between asset-heavy and asset-light 3PLs introduces a second axis of variation.
Asset-heavy operators—those owning warehouses, truck fleets, and material handling equipment—operate on fundamentally different economic timelines. Their sales cycles routinely exceed 90 days, and often stretch to six months, due to the complexity of contract logistics agreements, facility integration, and capital commitments. A marketing dollar spent in Q2 may not generate attributable revenue until Q4 or even Q1 of the following year.
When measured on a quarterly efficiency basis, these firms appear chronically underperforming. This is a measurement artifact, not a management failure. However, the artifact becomes a real liability when quarterly performance metrics drive budget allocation decisions.
Asset-light freight brokers and technology-enabled forwarders face the opposite constraint. Their sales cycles average 14 to 30 days. Marketing spend efficiency, therefore, reflects actual current-period conversion with minimal temporal distortion. These firms can reallocate budget weekly based on real-time cost-per-acquisition data, leading to sharper quarterly swings—both positive and negative.
The underlying supply chain economics reinforce the divergence. Asset-heavy firms hedge against market volatility through physical capacity ownership; their marketing strategy emphasizes relationship continuity and long-term contract renewal. Asset-light firms bet on volume and speed; their marketing must capture transactional spot business in real-time, making efficiency optimization a matter of survival.
LeadCoverage data shows asset-light 3PLs accounted for 80% of the high-efficiency cluster in Q4, while asset-heavy firms dominated the low-efficiency cohort—even when controlling for digital maturity scores (Source 1: Primary Data).
---
4. Why Q4? Seasonal Demand, Budget Resets, and Competitive Bidding
The Q4 timing of this divergence is not coincidental. Three structural factors converge during this quarter to amplify efficiency differences.
First, Q4 represents peak shipping season for retail, e-commerce, and manufacturing supply chains. Demand for logistics services spikes, and marketing budgets historically follow this pattern. However, the marginal effectiveness of additional spend during peak periods diminishes rapidly once a firm reaches its operational capacity. Asset-heavy firms, capacity-constrained by physical infrastructure, hit this ceiling earlier; their incremental marketing dollars generate declining returns. Asset-light firms, with more elastic capacity through sub-contracting, can continue to convert leads into revenue.
Second, Q4 is when firms set budgets for the following fiscal year. Marketing teams run experiments: testing new channels, increasing bid prices on competitive keywords, launching account-based marketing campaigns targeting large shippers. The outcome of these experiments determines budget allocation for the next 12 months. Firms with robust attribution systems can evaluate experiments rapidly and kill underperforming tactics within weeks. Firms without such systems cannot distinguish signal from noise until several months later, by which point budget is already locked in.
Third, digital advertising costs in the logistics vertical continue to rise. LinkedIn cost-per-acquisition for supply chain decision-makers has increased approximately 35% year-over-year across the industry. Google Ads CPC for high-intent logistics keywords follows a similar trajectory. These rising costs penalize undifferentiated 3PLs: those without strong brand recognition or unique value propositions must bid higher to achieve the same lead volume, compressing their efficiency margins.
LeadCoverage verified that the Q4 data period accounts for these seasonal effects, normalizing for baseline demand fluctuations (Source 1: Primary Data). The divergence persists after adjustment, confirming it reflects structural rather than cyclical variation.
---
5. Long-Term Supply Chain Impact: Consolidation and Specialization
Persistent marketing spend inefficiency carries consequences beyond internal budget frustrations. It will drive structural change in the logistics industry through two mechanisms: consolidation and specialization.
Consolidation: Low-efficiency 3PLs will face mounting pressure on customer acquisition costs relative to revenue per customer. As digital advertising costs rise and competitor efficiency improves, the breakeven point on customer lifetime value shifts. Firms unable to achieve marketing efficiency parity will either shrink their customer base (raising per-customer servicing costs further) or require acquisition by better-capitalized competitors who can absorb the marketing function and apply their own digital infrastructure.
Expect increased M&A activity targeting 3PLs with strong operational networks but weak marketing functions. The acquirer’s value creation thesis will center on applying their digital marketing stack to the target’s customer base, unlocking latent revenue through improved lead conversion.
Specialization: The high-efficiency cluster will not remain homogeneous. Three archetypes are emerging:
- Platform natives: Tech-enabled freight brokers and forwarders operating with zero-touch booking, automated pricing, and full-stack marketing automation. These firms achieve marketing efficiency through complete digital integration.
- Niche specialists: 3PLs focusing on verticals with high switching costs and long-term contracts—pharmaceutical cold chain, hazardous materials, defense logistics. Their marketing efficiency derives not from volume but from ultra-high conversion rates driven by deep domain expertise.
- Regional consolidators: Mid-sized asset-heavy operators that achieve marketing efficiency through geographic concentration, dominating local search and trade show presence in specific metro areas.
The middle of the market—undifferentiated, national-scope, mid-sized 3PLs with mixed digital adoption—faces the greatest risk. These firms lack the scale to build sophisticated marketing infrastructure and lack the specialization to achieve premium conversion rates.
---
6. Framework for Diagnosis: A Self-Assessment for 3PL Executives
Based on the LeadCoverage findings, executives can diagnose their marketing ROI positioning relative to industry peers using four diagnostic questions:
- Attribution latency: What is the average time between first marketing touchpoint and pipeline opportunity creation? If exceeding 30 days, the firm likely operates in the low-efficiency cluster due to inability to optimize spend allocation in real-time.
- Channel fragmentation: How many marketing channels receive budget allocation without measurable attribution to closed revenue? If more than two, the firm is likely bleeding efficiency into non-trackable spend.
- Cost-per-lead trajectory: Is cost-per-lead decreasing quarter-over-quarter at the same time as lead volume increases? If not, the firm may be approaching the diminishing returns zone of its current marketing infrastructure.
- Capacity-to-marketing alignment: Does the marketing function have visibility into operational capacity constraints? If marketing generates leads that operations cannot serve, efficiency metrics will appear artificially high while actual revenue conversion suffers.
Firms answering positively to three of four conditions likely belong to the high-efficiency cohort. Firms answering negatively to three of four should expect continued divergence from industry leaders.
---
Market Predictions
The Q4 divergence documented by LeadCoverage represents a leading indicator, not a historical curiosity. Three forward-looking statements can be made with reasonable confidence:
First, the dispersion in marketing spend efficiency will widen further over the next four quarters. The compounding effect of digital infrastructure investment means early movers will extend their advantage while laggards fall further behind, absent fundamental restructuring.
Second, investor and analyst scrutiny of 3PL marketing efficiency will intensify. Private equity firms and venture capital investors already assess marketing ROI as a core diligence metric. Public markets will follow, with sell-side analysts incorporating efficiency benchmarks into valuation models for logistics and transportation equities.
Third, the efficiency divergence will accelerate the bifurcation of the logistics industry into two distinct operating models: high-volume, low-margin digital marketplaces and high-specialization, high-margin service providers. The middle-market 3PL with no digital differentiation and no niche specialization will face existential margin compression.
The Q4 data does not merely describe a quarterly anomaly. It illuminates a structural transition in how logistics firms must compete for customer attention, pipeline conversion, and revenue growth in a post-pandemic market where digital capability determines survival.
Trade Metrics
Related Datasets
Q4 Cross-Border Logistics Report
PDF • 4.2 MB
Automotive Parts Supply Chain Index
CSV • 1.1 MB